

Bitcoin Short Squeeze Flushes Out Late Longers as Funding Turns Negative: Classic Capitulation Signal
Bitcoin is struggling to reclaim the $90,000 level as selling pressure continues to dominate across the crypto market. The sharp decline from the all-time high has fueled growing speculation that the current cycle may have already peaked, with many analysts now calling for the beginning of a bear market. Sentiment has shifted rapidly, and fear is spreading as traders question whether the bullish structure has been permanently broken.
However, not everyone agrees with the bearish outlook. A segment of market participants still expects a rebound, arguing that the correction is part of a broader continuation pattern rather than the end of the cycle. These optimistic observers believe that higher prices could still unfold once selling exhaustion sets in.
According to top analyst Darkfost, the recent price action reflects a notable behavioral shift in traders. He explains that investors who attempted to long the market throughout the correction have finally been squeezed out.
Funding rates, which had remained elevated during the decline, have now cooled and even turned negative — a strong signal that sentiment has flipped. Darkfost notes that traders waited for Bitcoin to correct more than 30% before shifting aggressively into short positions, highlighting a delayed reaction that often appears near market inflection points.
Funding Rates Flip Negative as Short Dominance Takes Over
Darkfost explains that the latest shift in funding rates is more meaningful than it appears on the surface. He notes that traders often assume the neutral funding level is 0%, but that is not the case. Most exchanges — including Binance — embed an interest component of roughly 0.01% into the funding calculation.
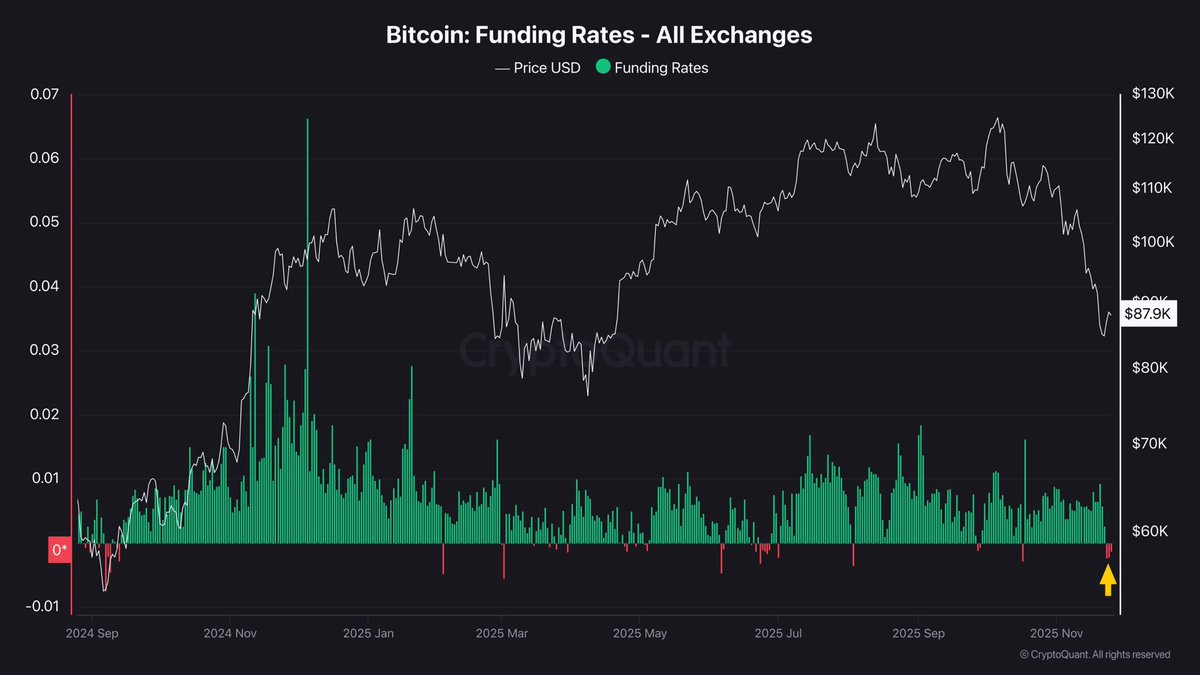
This means that when funding drops below 0.01%, it already reflects short-side dominance. Therefore, when funding turns negative, it signals an even stronger tilt toward aggressive short positioning. According to Darkfost, this marks a clear behavioral change among derivatives traders, suggesting that the market has transitioned from forced long unwinds to conviction-based short exposure.
Historically, these shifts tend to occur only once a correction is already deep into its progression. Darkfost highlights that such funding transitions often reflect trader capitulation — where participants who fought the downtrend finally flip and attempt to follow momentum, but only after most of the move has already unfolded.
This phenomenon has appeared in previous cycle retracements and has frequently coincided with late-stage bottoms. He adds that Bitcoin may now be entering a disbelief phase, where price begins climbing while shorts continue to pile in. If this dynamic persists, it could act as fuel for an upside reversal, especially if spot demand wakes up and liquidations pressure the short side instead.
BTC Price Testing Short-Term Supply
Bitcoin is attempting to stabilize after a sharp decline, with the chart showing price currently trading around $87,000 following a rebound from the recent plunge near $80,000. The downtrend remains clearly defined, as BTC continues to trade below the 50-day, 100-day, and 200-day moving averages, signaling persistent bearish momentum.

The slope of these moving averages has turned downward, reinforcing the shift in trend structure. Despite the bounce, the recovery lacks strong volume support, which suggests that buyers have not yet returned with conviction.
The chart shows that previous support levels around $95,000 and $100,000 have now become resistance areas, making them key levels to watch for any attempted recovery. A failure to reclaim these zones could trigger renewed selling pressure and a retest of the recent lows. However, the wick below $80,000 indicates aggressive buying at the lows, which could signal that a short-term bottom is forming if buyers continue to defend higher lows in the coming days.
Market sentiment remains fragile, yet the stabilization above $85,000 hints at a potential consolidation phase rather than immediate continuation of the decline. A sustained move above the 100-day moving average would be the first meaningful signal of regained bullish momentum.
Featured image from ChatGPT, chart from TradingView.com
You May Also Like

The Nasdaq rose 1% during the day, setting a new record high
Trump is running out of time — and Republicans ready to abandon him

