Bitcoin Flashes A Triple Bearish Divergence: CMT Sounds The Alarm
Bitcoin’s three-year advance may be rolling over, according to Chartered Market Technician Tony Severino, who argues that BTC has now completed a “triple bearish divergence” on higher timeframes – a structure he characterises as the trend “dying under the hood” even as price printed fresh highs.
Bitcoin Has Hit A Triple Bearish Divergence
In a video published on November 24 and shared on X, Severino says he had to go beyond standard references to formalise the pattern. “I really never heard that statement before,” he admits of the term triple negative divergence. “There wasn’t a lot of information on Google […] I turned to AI, turned to ChatGPT.” His working definition: “three successive higher highs on price and three successive lower highs on the technical indicator.”
A standard bearish divergence occurs when price makes a higher high while an oscillator such as RSI, MACD or Stochastic posts a lower high, signalling trend exhaustion. Extending that to three peaks, Severino says, amplifies the warning: “A triple negative or triple bearish divergence is basically the market screaming, price is still drifting higher, but under the hood, this trend is dying.” Later he adds, “A single divergence is already a warning. A triple divergence is like yellow, orange, flashing red.”
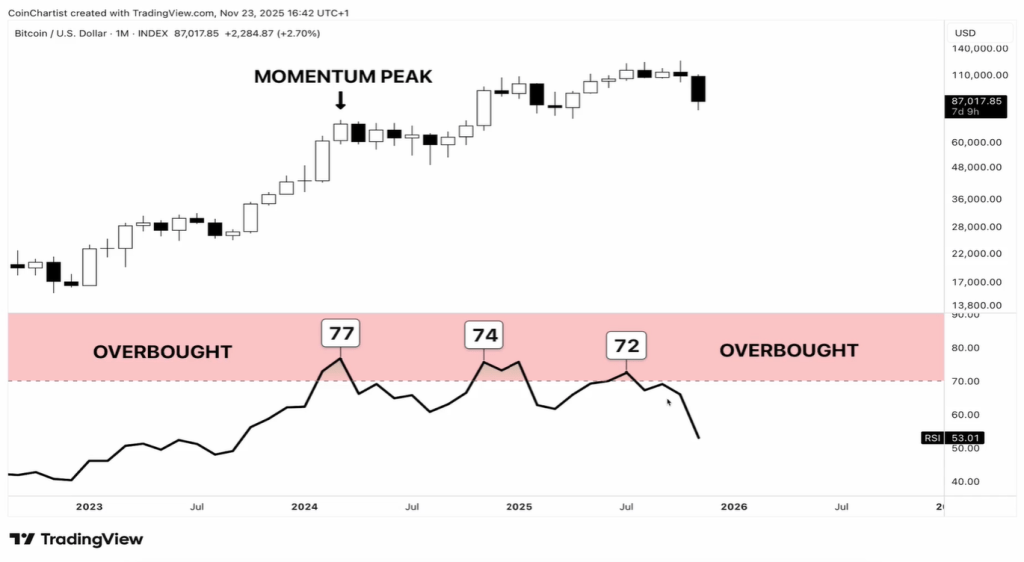
Severino maps this pattern onto Bitcoin’s bull cycle using the monthly chart, anchored around three key highs. The first, he argues, came around the spot ETF launch and aligned with a wave-three impulse in his Elliott Wave count. “This was our ETF launch and it was during our wave three impulse […] everybody’s excited. We had the ETF launch […] strong volume, strong momentum,” he says, calling it the cycle’s momentum peak.
The second high broke that level but on weaker internals. “Second high breaks the old high. The indicator’s high is weaker. This represents fewer aggressive buyers. Early participants start taking profits. This was me. I started taking profit here,” he notes. In his interpretation, that push represented a fifth wave.
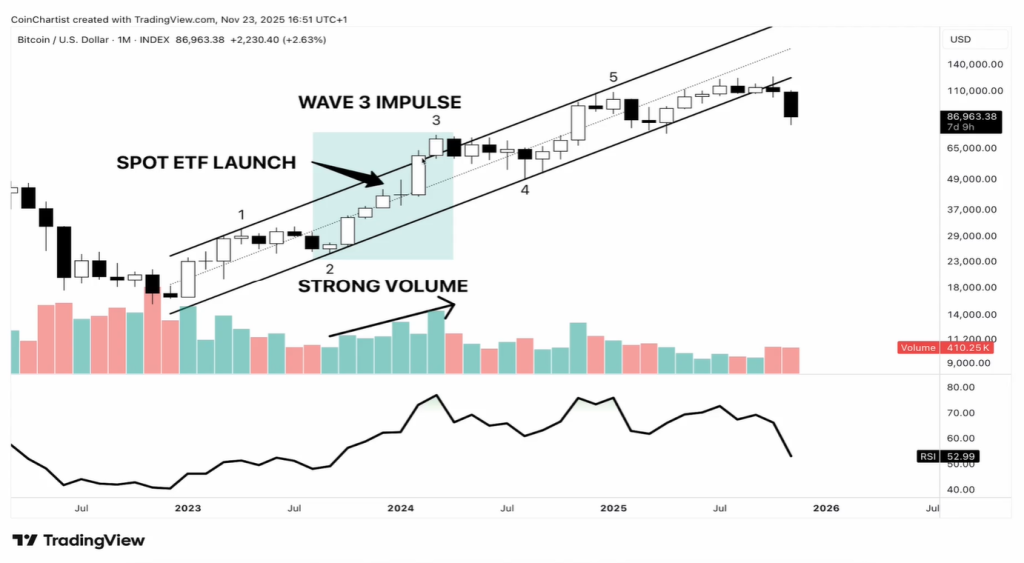
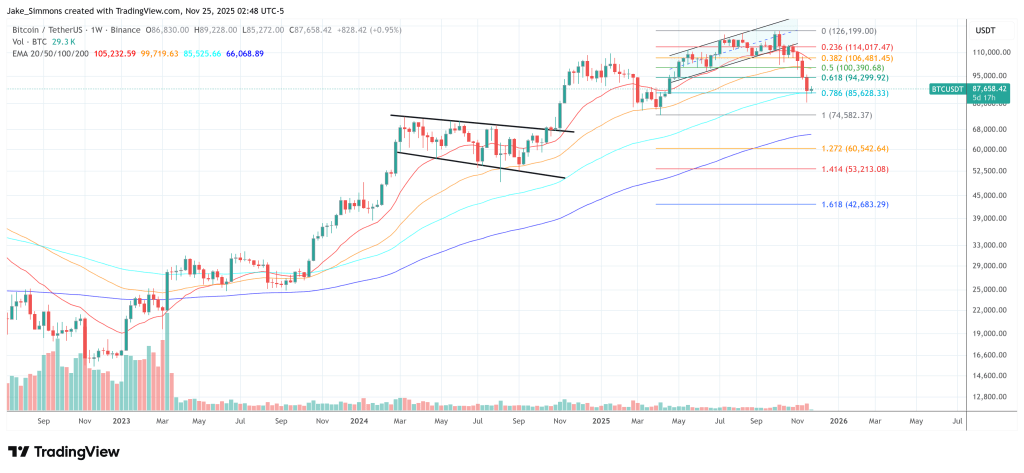
The third high, marginally above prior peaks near $126,000, is where he sees exhaustion. “On the third high, price index is higher. Marginal new high […] I sold around $105k […] we went to $126k, so I left only a very small amount on the table to not get caught up in what comes after all this,” he says. The oscillator, however, made yet another lower high: “Buyers are exhausted at this point. Shorts are covering, late FOMO buyers push it just a little bit higher. Pros use this zone to offload positions or start shorting.”
He argues that sentiment at the top was complacent rather than euphoric. “I don’t think we were euphoric here. I think we were euphoric at this one […] but we were very complacent this whole time […] everybody just was like, it’s going up forever.”
Crucially, Severino insists the divergence is a setup, not a standalone trigger: “You want confirmation before acting.” He points to several. First, a break of the rising trendline connecting the major swing lows: “Here is our trend line and we are below. There is our confirmation.” Second, loss of key moving averages such as the 20 and 50 EMA that had supported the uptrend. Third, a regime shift in weekly RSI: during the bull, it repeatedly bounced in the 40–50 zone, but now, he says, “falling below it is confirmation that the trend is now no longer holding.”
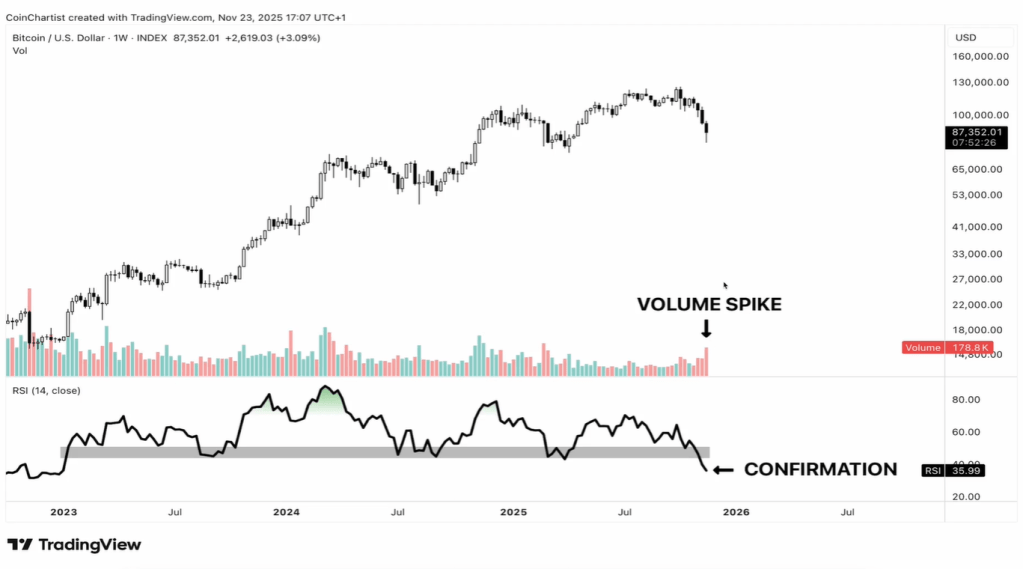
On volume, he warns against reading the recent spike on a down candle as capitulation. While the FTX bottom showed extreme, climactic volume, the latest breakout in selling may instead be “the breakout and start of a trend” to the downside, he suggests, especially given the declining volume into Bitcoin’s final highs.
How Low Can Bitcoin Go?
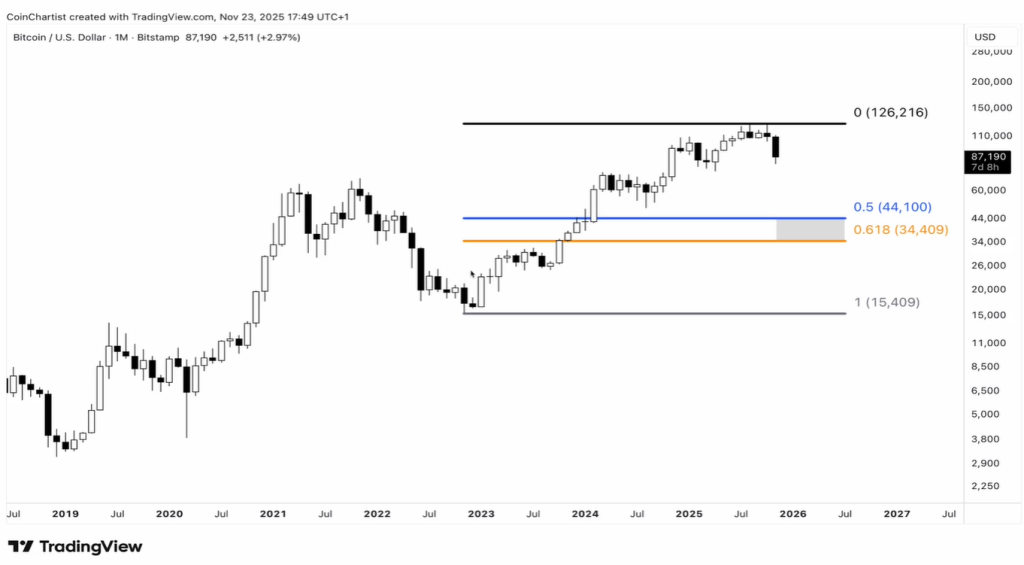
For potential downside, Severino overlays Fibonacci levels on the full advance and references guidance that triple divergences often resolve toward the 0.5–0.618 retracement between $44,100 and $34,409. In Bitcoin’s case, he marks a wide lower zone where an A-B-C structure could terminate, estimating “about like 60 something percent, maybe even closer to 70” from the top – “very par for the course for a Bitcoin bear market,” in his words.
More ominously, he hints at a “bigger version of this” on even higher timeframes, suggesting a larger triple divergence may be forming with the recent structure nested inside it. “This could not be so great for the higher time frames Bitcoin,” he says.
Still, he repeatedly stresses uncertainty and risk management. “I can’t say that this signal is the end-all be-all […] it doesn’t guarantee anything,” he says. “I definitely don’t want you to be like, hey, Tony, well, I believe you 100%. Immediately, I’m going to sell my coins. No, it’s not financial advice […] It’s more about how you manage risk.”
At press time, Bitcoin traded at $87,658.
You May Also Like

XRP Whales Offload 200 Million XRP as Market Pauses Near $3

One Of Frank Sinatra’s Most Famous Albums Is Back In The Spotlight