Pepe Coin price slowly forms a bullish pattern as exchange inflows surge
Pepe Coin price has crashed over the past few months, and is now hovering at its lowest point since Oct. 10.
- Pepe Coin price remains in a deep bear market this month.
- The number of Pepe tokens in exchanges has surged.
- Pepe has formed the bullish falling wedge pattern, pointing to more gains.
Pepe Coin (PEPE) plunged to $0.00000400, down by 75% from its highest point this year and 85% below the all-time high. This decline occurred as futures open interest dropped from over $1 billion in July to $200 million amid ongoing deleveraging.
Fundamentals suggest that the Pepe price may be on the verge of more downside in the near term. In addition to the falling future open interest, there are signs that investors are dumping their tokens.
Nansen data shows that the number of Pepe tokens on exchanges has soared to 258.7 trillion from this month’s low of 250 trillion. This means that investors have capitulated and dumped over 8 trillion tokens, currently valued at over $32 million.
A potential reason for the selling is that the long-term chart shows that Pepe has been forming a giant head-and-shoulders pattern, which normally leads to more downside.
Another possible reason why Pepe price has slumped is that most meme coins have plunged. Shiba Inu price has plunged by over 70% from the year-to-date high, while other tokens like Fartcoin and Bonk have had similar dumps.
Pepe Coin price technical analysis
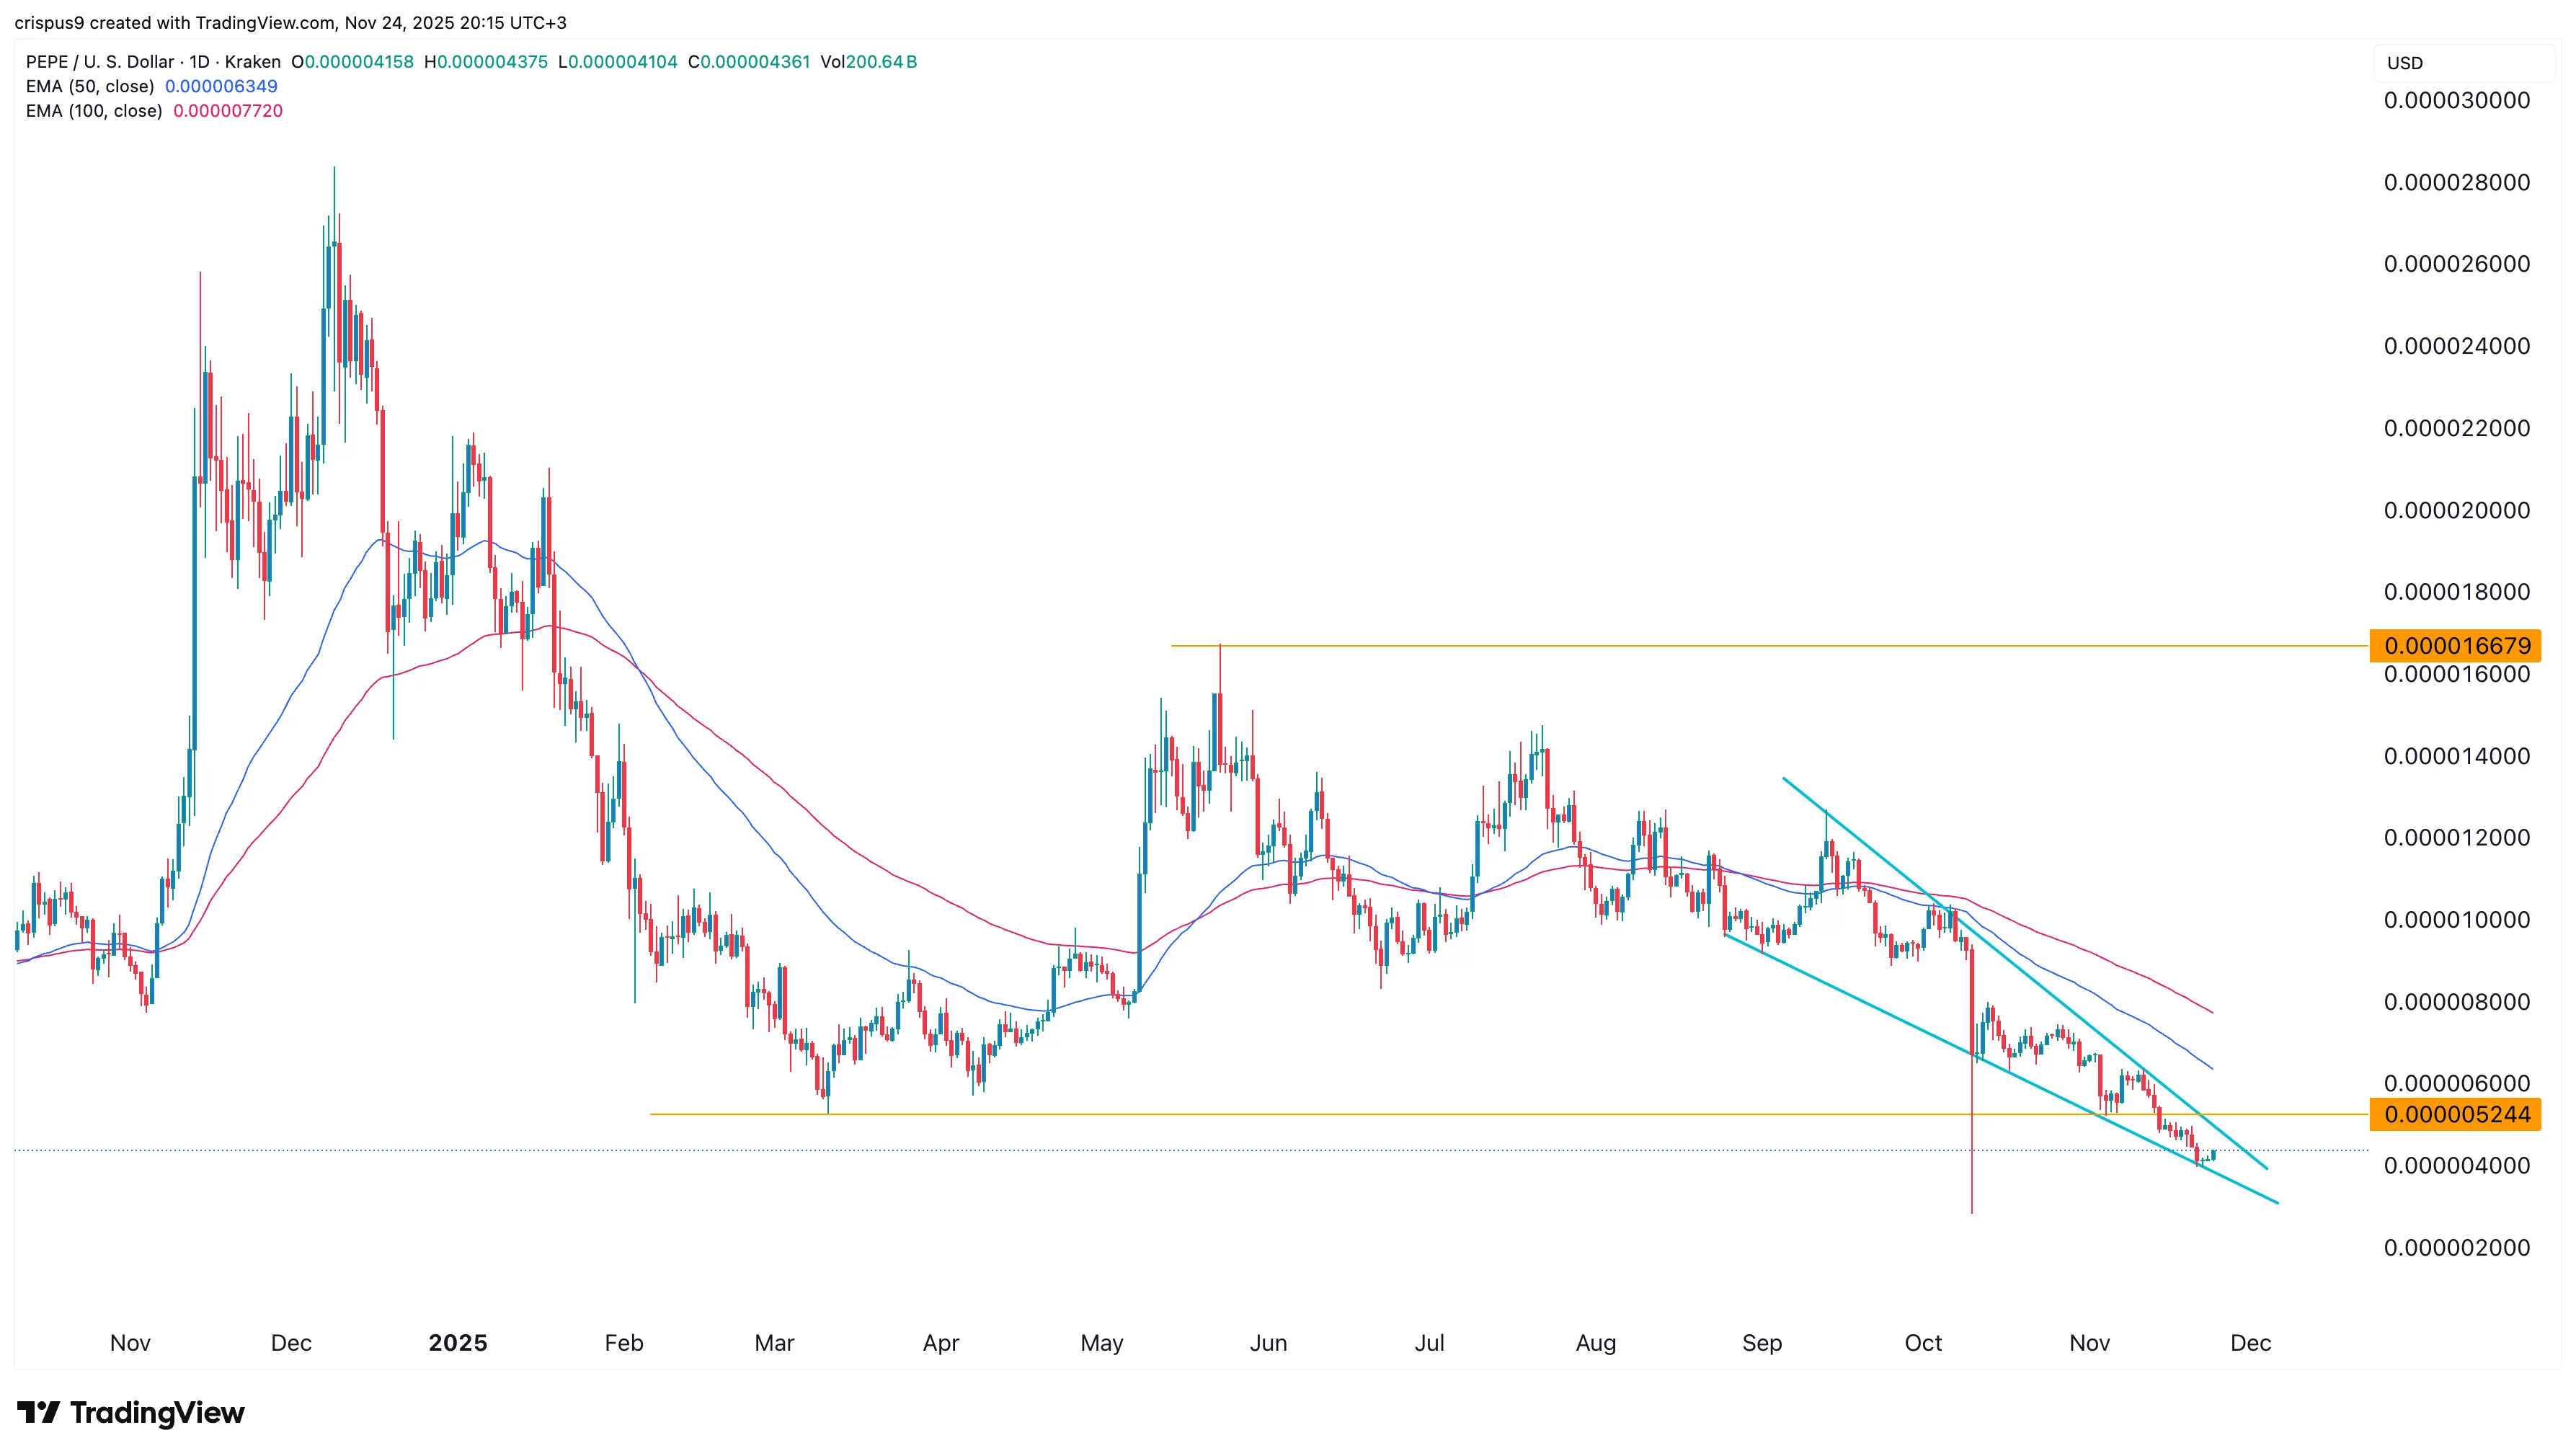
The daily timeframe chart shows that the Pepe price has been in a strong bear trend in the past few months. It plunged from a high of $0.00001667 in May to the current $0.0000040.
The token has dived below the important support level at $0.000005245, its lowest level in May this year. It remains below all moving averages, a sign that bears are in control.
On the positive side, the coin has formed a falling wedge pattern, with its two lines about to converge. A bullish breakout typically happens at this juncture.
Therefore, while the long-term outlook for Pepe is bearish, there is a likelihood of a near-term relief rally. If this happens, the next key target level to watch will be at $0.000010.
You May Also Like

CME Group to launch Solana and XRP options on October 13

Interest rate cuts are coming – investors can expect a 200% increase in returns through Goldenmining