

Ethereum Classic (ETC) Price Prediction 2025–2029: Can ETC Hit $20 Soon?
- Ethereum Classic stabilizes as tightening volatility hints at major breakout soon.
- ETC nears crucial support while traders anticipate decisive momentum shift ahead.
- Technical indicators show consolidation, suggesting Ethereum Classic prepares significant movement.
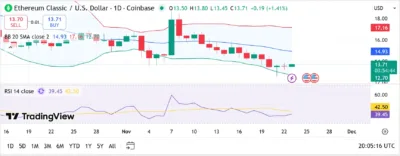
Ethereum Classic (ETC) is trading around $13.71 as it stabilizes after several weeks of bearish pressure. The tightening volatility, neutral RSI, and narrowing Bollinger Bands suggest the market is entering a period where a major breakout could occur. With momentum slowing and the price hovering above its lower support region, traders are closely watching for whether ETC will initiate a recovery or continue its downward drift. The asset’s modest 1.41% increase in the last 24 hours indicates early signs of strengthening, although not enough yet to confirm a trend reversal.
ETC’s chart shows the market resting at a critical juncture. As the broader crypto environment attempts to recover from recent weakness, maintaining current support levels could determine whether Ethereum Classic resumes a consolidation pattern or begins a new upward cycle. The price action reflects a market still undecided, and all indicators point toward waiting for a strong catalyst.
Also Read: Tensor (TNSR) Price Prediction 2025–2030: Can TNSR Hold Above $0.15 Before the Next Move?
Technical Analysis
Bollinger Bands
The Bollinger Bands on the daily chart present a notable tightening pattern, with the upper band positioned near $17.16, the middle band at $14.93, and the lower band at $12.70. ETC is currently trading beneath the middle band, reflecting a neutral-to-bearish tendency that has shaped recent sessions. Historically, when prices remain compressed beneath the middle band, buyers tend to wait for clearer signals before committing to large positions.
Should ETC rise above the middle band at $14.93, it could mark the beginning of a bullish attempt to test the upper band at $17.16. A breakout above that level would likely shift market sentiment toward optimism and could push ETC toward the $18 region. Conversely, if the price falls below the lower band at $12.70, it may trigger a new wave of selling pressure that could drive ETC toward the $11.50 support.
The narrowing of the bands strongly implies that the market is preparing for a substantial move. Until that breakout signals direction, the asset is likely to remain within its consolidation zone.
RSI Behavior
The Relative Strength Index is currently at 39.45, accompanied by a moving average of 42.50. This reading places ETC in a neutral-to-bearish zone, indicating balanced conditions where neither side has full control. The RSI does not yet signal oversold conditions, suggesting additional downside is possible if sellers regain momentum. However, the indicator also reflects the possibility of an upward reversal should momentum accumulate in favor of buyers. Breaking above the 50 mark would be a strong sign of bullish intent, while a decline toward 30 could confirm ongoing bearish sentiment.
Support and Resistance Levels
Ethereum Classic finds immediate support around $12.70, which aligns with the lower Bollinger Band. This level has shown resilience during recent declines and offers a potential accumulation zone for traders anticipating a bounce. Resistance begins at the $14.93 level, where the middle Bollinger Band sits, and represents the first obstacle ETC must overcome to regain bullish traction. The more significant resistance lies at $17.16, corresponding to the upper band. Surpassing this level would signal a strong recovery and could open the path toward the $18–$19 area.
If ETC fails to hold above support at $12.70, the price could slide into a deeper correction, potentially testing $11.50. A breakout above resistance, however, would indicate renewed enthusiasm in the market and could mark the start of a more sustained upward trend.
Source: Tradingview
Ethereum Classic (ETC) Price Predictions (2025–2029)
| Year | Minimum Price | Average Price | Maximum Price |
| 2025 | $12.00 | $15.00 | $18.00 |
| 2026 | $15.00 | $18.50 | $22.00 |
| 2027 | $18.00 | $22.00 | $26.00 |
| 2028 | $22.00 | $26.00 | $30.00 |
| 2029 | $26.00 | $30.00 | $35.00 |
2025
Ethereum Classic is expected to move within a price range of $12 to $18 throughout 2025. With the Bollinger Bands tightening and the RSI holding near neutral levels, ETC appears poised for a significant movement once a clear momentum shift emerges. Should the asset break above the $17.16 resistance, a push toward the $18 mark becomes increasingly feasible.
2026
By 2026, Ethereum Classic is likely to benefit from broader blockchain adoption and improved sentiment across the market. This could support an average price near $18.50, with potential highs reaching up to $22. Growing institutional interest and improved utility could play key roles in this upward progression.
2027
In 2027, ETC may experience more robust growth as blockchain infrastructure continues to mature and investor confidence strengthens. The asset may maintain an average price around $22, with upper projections near $26 as demand increases.
2028
As decentralized systems and cross-chain platforms gain wider adoption by 2028, Ethereum Classic may see renewed relevance as a secure proof-of-work chain. The price could move into the $22 to $30 range, reflecting increased utility and stability within the ecosystem.
2029
By 2029, Ethereum Classic could potentially exceed $30 and approach $35 if market conditions remain supportive. The asset’s longevity and strong fundamental base may reinforce its position as a reliable blockchain with long-term upside.
Conclusion
Ethereum Classic is currently navigating a consolidation phase marked by low volatility and neutral RSI readings. These conditions often precede major price movements, and the narrowing Bollinger Bands reinforce this expectation. If ETC holds above its $12.70 support level and manages to break through resistance at $14.93 and later at $17.16, the asset may enter a period of renewed bullish momentum.
Over the long term, the outlook for Ethereum Classic remains optimistic. With continued development and increasing adoption, ETC may see steady growth that propels it toward the $30–$35 range by 2029. As the cryptocurrency landscape evolves, ETC may continue to serve as a significant and reliable network rooted in decentralization and security.
FAQs
1. What is the current market sentiment for Ethereum Classic (ETC)?
The market sentiment for Ethereum Classic is neutral-to-bearish, with the RSI sitting near the lower neutral boundary and narrowing Bollinger Bands indicating a potential surge in volatility. This reflects a market waiting for a strong directional move.
2. Can Ethereum Classic break above the $18 mark in 2025?
Ethereum Classic can break above $18 if it maintains support at $12.70 and manages to rise above resistance at $14.93 and $17.16. A successful break above the upper Bollinger Band would likely drive ETC toward the $18 zone.
3. How should traders approach ETC at its current price?
Traders should closely observe whether ETC breaks above $14.93 or falls below $12.70. These levels are crucial for determining the next trend direction. Until a breakout occurs, caution is advised as the market remains in consolidation.
4. How does Ethereum Classic compare to other cryptocurrencies?
Ethereum Classic remains one of the longest-standing proof-of-work blockchains, offering resilience, decentralization, and a strong historical foundation. While it may not move as aggressively as newer altcoins, it provides stability and a clear value proposition that appeals to long-term investors.
5. What is the price prediction for Ethereum Classic in 2029?
By 2029, Ethereum Classic could reach between $30 and $35, assuming the market supports its long-term growth trajectory and adoption continues to expand across the crypto ecosystem.
Also Read: Cardano (ADA) Price Prediction 2025–2030: Can ADA Hit $0.32 Soon?
The post Ethereum Classic (ETC) Price Prediction 2025–2029: Can ETC Hit $20 Soon? appeared first on 36Crypto.
You May Also Like

MSBT Is “Massive Bitcoin Bet” With $160B Forecast; Strategy CEO Says

Kenya places Solana at center of national digital coin experiment

