Will Bitcoin Price Crash to $15,000?
Bitcoin price has slipped sharply again, dropping into the mid-80k range and sparking panic across the market. At the same time, the US job report — delayed for more than a month because of the government shutdown — finally landed with a strange message: hiring is stronger than expected, yet unemployment has climbed to its highest level since 2021. When you combine this mixed macro signal with Bitcoin price clearly showing weakening structure on the chart, the fear-driven question naturally surfaces: is a crash to 15000 possible?
What the New Job Report Really Means for Bitcoin Price Prediction
The economy added 119000 jobs in September, more than double what economists predicted. That shows the job market is still functioning, not collapsing. The rise in unemployment to 4.4 percent came because more people entered the workforce, not because companies suddenly started firing workers. A cooling-but-still-working economy doesn’t create the type of liquidity panic that usually sends Bitcoin into catastrophic lows. It suggests the economic backdrop is uncertain, but not broken. Traders see this as a reason to stay cautious, not a reason to abandon risk assets outright.
Bitcoin Price Daily Chart Paints a Much Darker Picture
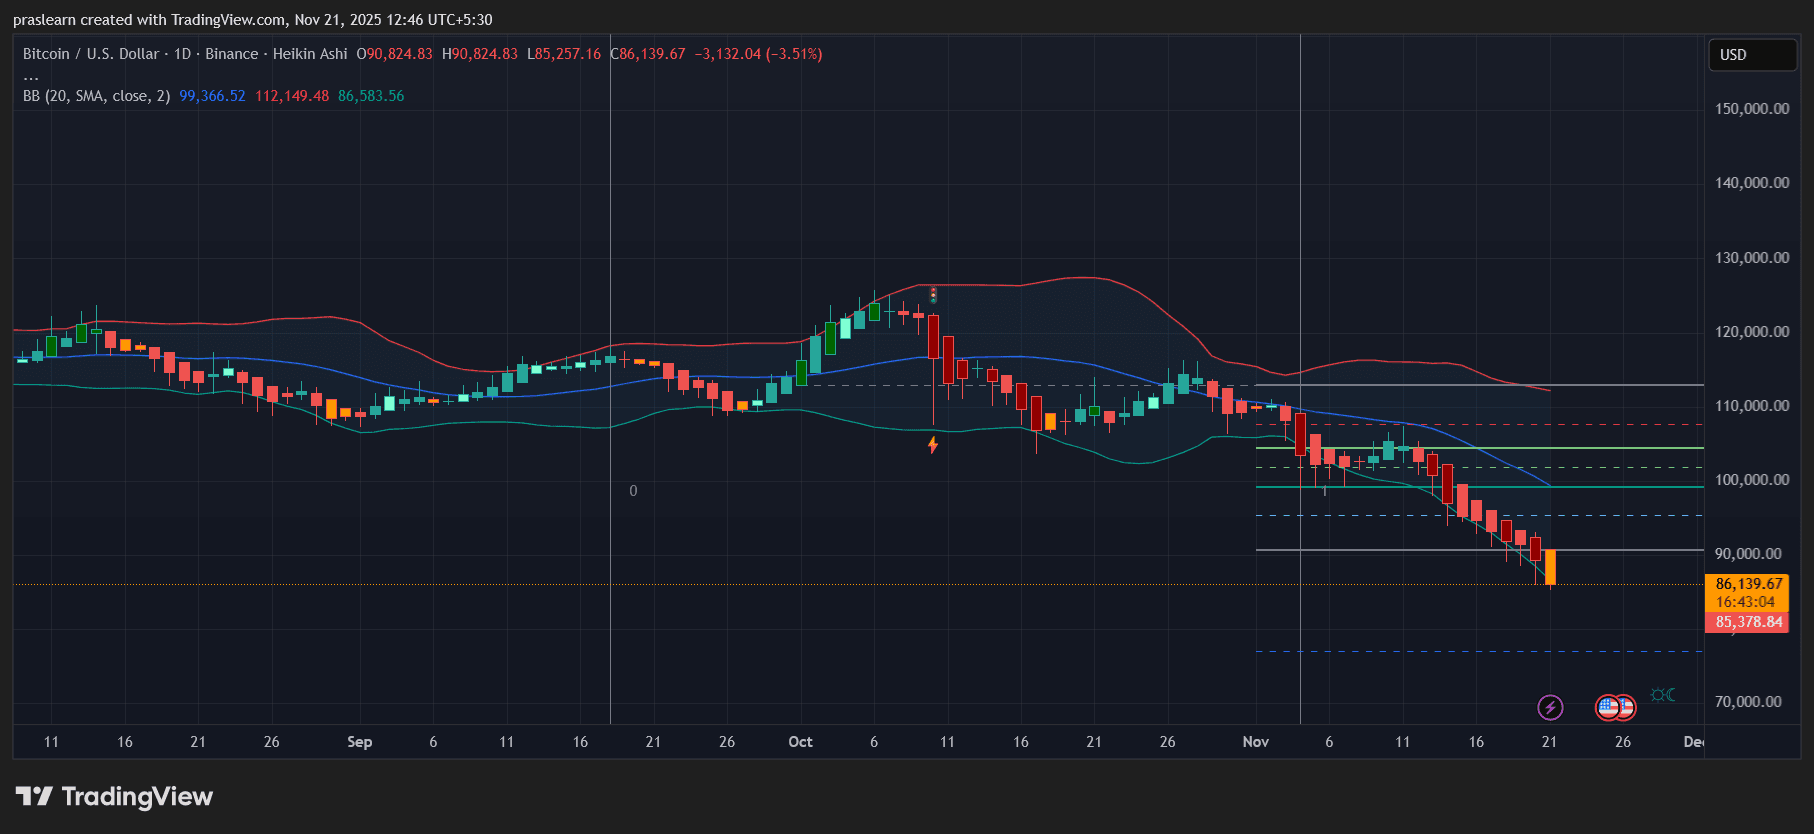 BTC/USD daily Chart- TradingView
Now shift to the chart, because this is where the real tension sits. The Heikin Ashi candles show a relentless downtrend: long red bodies, tiny wicks, and no sign of buying pressure. Bitcoin price has been sliding along the lower Bollinger Band for days, which signals sustained bearish momentum rather than a short-term dip. Multiple Fibonacci support layers have already failed, and price remains far below the 20-day moving average. Market structure is decisively bearish. This isn’t a shallow correction; it’s a proper trend reversal.
Bitcoin Price Prediction: Do the Technical Levels Support a Drop Toward 15,000?
Even with the current selloff, the chart doesn’t point anywhere near 15000. BTC price is sitting around 86139, pressing into support near 85378. If this zone breaks, the next realistic landing area sits between 78000 and 76000, where strong liquidity previously held. If selling pressure intensifies over the next few weeks, the deeper structural support sits around 60000 — a level that aligns with earlier consolidation and heavy long-term demand. None of these levels resemble a freefall to 15000. The chart simply doesn’t justify that kind of collapse unless a black-swan event hits the market.
Why Traders Are Suddenly Obsessed With the Bitcoin Price Crash Narrative
The emotional tone of this decline feels similar to late 2022, when BTC price was tumbling after FTX’s implosion. But structurally, this cycle is completely different. In 2022, liquidity evaporated and Bitcoin broke below multi-year support. Today, Bitcoin price is correcting inside a long-term uptrend with no structural macro failure in sight. The fear is real, but the conditions that created the 2022 crash are not present. The current downtrend is sharp, but it is not system-breaking.
Bitcoin Price Crash: How Low Does This Downtrend Go?
$Bitcoin is likely to continue falling in the near term. A retest of 85000 is already in motion. If the market fails to hold this level, a drift toward the 78000 to 76000 band looks increasingly likely. If sellers continue dominating through December, a deeper slide toward the 60000 region becomes plausible. These levels fit the trend, the momentum, and the structure. But none of them resemble a meltdown to 15000. That scenario would require a global liquidity freeze, a major exchange failure, or a severe economic shock — none of which show up in either the job market data or the chart.
$BTC price is clearly in trouble. The downtrend is clean, strong, and not finished yet. But the chart does not support the idea of a catastrophic crash. What we’re seeing is a deep correction, not a structural collapse. A realistic downside sits between 76000 and 60000. The fear-driven calls for 15000 are emotional, not technical.
You May Also Like

Spot Bitcoin ETFs Face Outflows Despite Strong March Inflows

Strategy CEO: If Morgan Stanley allocates 2% to Bitcoin, it will bring in approximately $160 billion in funds.