Bitcoin Mean Reversion Oscillator Prints First Green Oversold Bar in Months – A Classic Bull-Market Bottom Signal
Bitcoin continues to struggle around the $90K level as the market battles intense selling pressure and widespread fear. Short-term sentiment remains fragile, with investors reacting to rapid price swings and mounting downside volatility. Yet, beneath the noise, key on-chain metrics are beginning to show signs that the correction may be nearing exhaustion.
According to analyst On-Chain Mind, Bitcoin’s Mean Reversion Oscillator has just printed its first green oversold bar in months, a signal that has historically aligned with late-stage retracements during bull markets. This oscillator measures how far price has deviated from its cyclical mean, helping identify when Bitcoin becomes overstretched to the downside.
Each time this indicator dipped into its green oversold zone in previous cycles, Bitcoin was either forming a macro bottom or preparing for a significant rebound. The fact that this signal has appeared while BTC consolidates above $90K — despite severe profit-taking, forced liquidations, and structural fear — suggests that strong hands may be quietly absorbing supply.
Historical Bottom Signals Align as Macro Tailwinds Strengthen
On-Chain Mind explains that Bitcoin’s current Mean Reversion Oscillator reading aligns closely with historical patterns seen during bull market retracements. Each time the oscillator dipped into the green oversold zone while the 35 line held, Bitcoin formed a cyclical bottom before resuming its upward trajectory. This line has acted as a structural support level across multiple market cycles, and the fact that it is holding once again reinforces the idea that strong hands are stepping in as weaker participants capitulate.
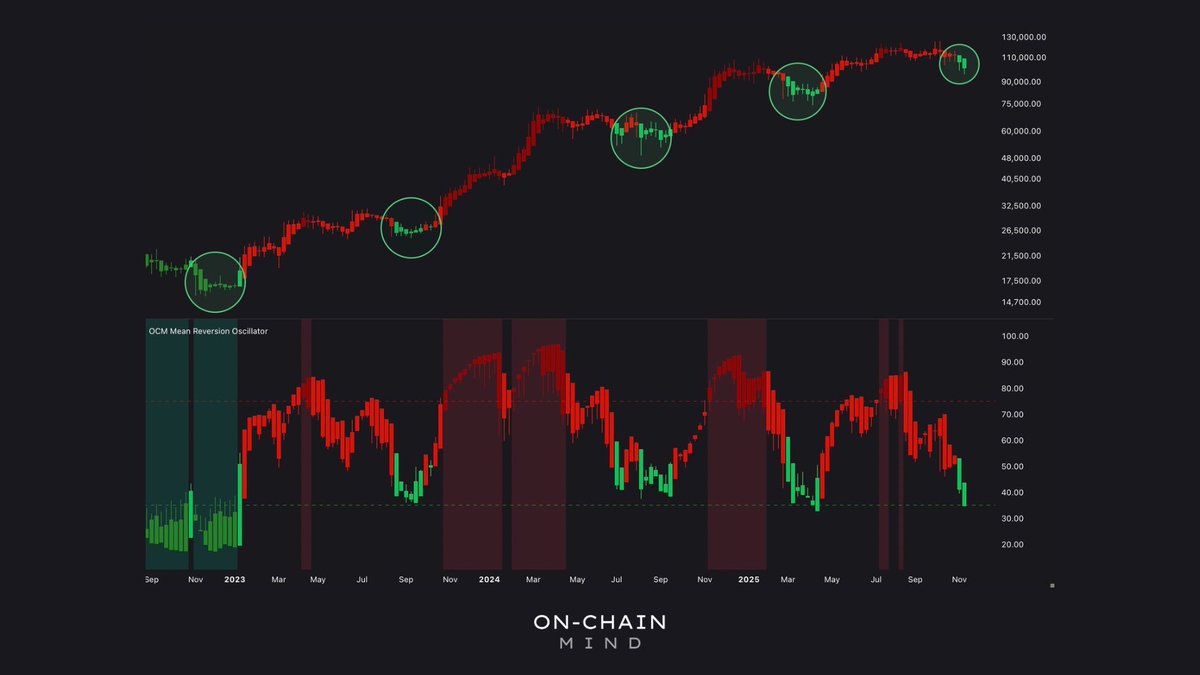
According to On-Chain Mind, when this indicator flashes green during an ongoing bull market, it often marks textbook accumulation territory — the kind of opportunity that appears only a few times per cycle. The current setup resembles previous late-stage pullbacks rather than the beginning of a prolonged bear trend.
Adding to this outlook, NVIDIA’s blowout earnings delivered a major confidence boost to U.S. equities. With revenue and guidance far exceeding expectations, the results signal that AI-driven demand remains strong. In broader macro terms, such strength in tech leadership often spills over into higher-risk assets like crypto, improving liquidity and investor sentiment.
Testing Support as Momentum Begins to Stabilize
Bitcoin’s latest daily chart shows price attempting to stabilize after a sharp multi-week decline, with BTC currently trading near $92,000. This level is acting as a temporary support zone following the breakdown from the $100K area, where sellers aggressively dominated order books.
The chart reveals a series of lower highs and lower lows — a classic short-term downtrend structure — but the recent candlesticks hint at reduced selling momentum compared to the peak pressure seen earlier in November.

The 50-day and 100-day moving averages have both turned downward, reflecting weakening short-term trend strength, while the 200-day MA remains far below price, highlighting that the broader bullish cycle may not be invalidated yet. Importantly, the current candle structure shows smaller bodies and longer lower wicks, suggesting buyers are beginning to absorb sell-side liquidity around the $90K–$92K region.
Volume profiles also support this shift. While capitulation-like spikes occurred during the heaviest drop, trading activity has now normalized, indicating panic selling is cooling off. Historically, such deceleration after a steep leg down often precedes a relief bounce, even if volatility persists.
Featured image from ChatGPT, chart from TradingView.com


You May Also Like

Justice à la Carte: The ICC’s Curious New Recipe for Removing Karim Khan — Abbi Kanthasamy

Insurgents attack multiple towns in northern, central Mali