

Bitcoin (BTC) Death Cross Flashes Again: Is a 130K Target Still Possible?

- Bitcoin’s latest Death Cross has appeared at a major inflection point in the market cycle.
- A 35% rise from current levels could place Bitcoin near $130,000 in 2026.
- Analysts warn that losing the 2025 opening price and the $92,000 level could end the bull cycle.
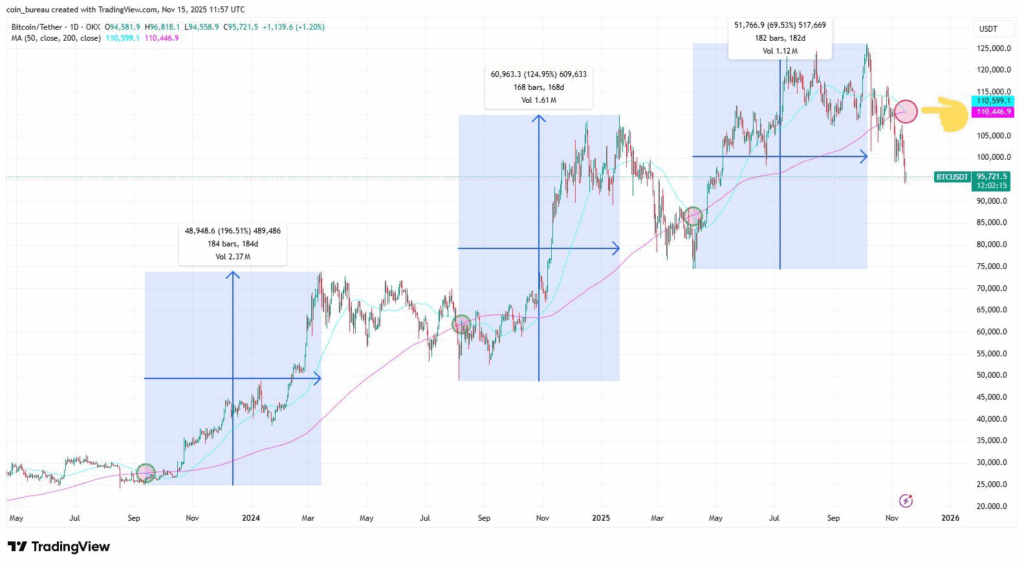
Bitcoin has triggered a new Death Cross, a rare chart signal that occurs when the 50-day moving average slips below the 200-day moving average. This pattern has been a turning point in earlier cycles, and traders now wonder whether the latest event marks another local bottom or signals deeper weakness ahead.
Historical data shows that similar crosses in September 2023, August 2024, and April 2025 were followed by strong recoveries. Those rallies measured 195%, 125%, and 70%.
 Source: X
If the market repeats even part of this pattern, a move of around 35% from current levels could carry Bitcoin toward the $130,000 region by May 2026.
Another factor adding interest to the timing is the Federal Reserve’s plan to end quantitative tightening on December 1. Market watchers believe this shift could ease financial conditions and create a more supportive backdrop for risk assets, including Bitcoin.
With several macro signals aligning, investors are closely assessing whether the latest cross will once again lead to a major trend reversal.
Analysts Track the Battle Around the 50-Week Moving Average
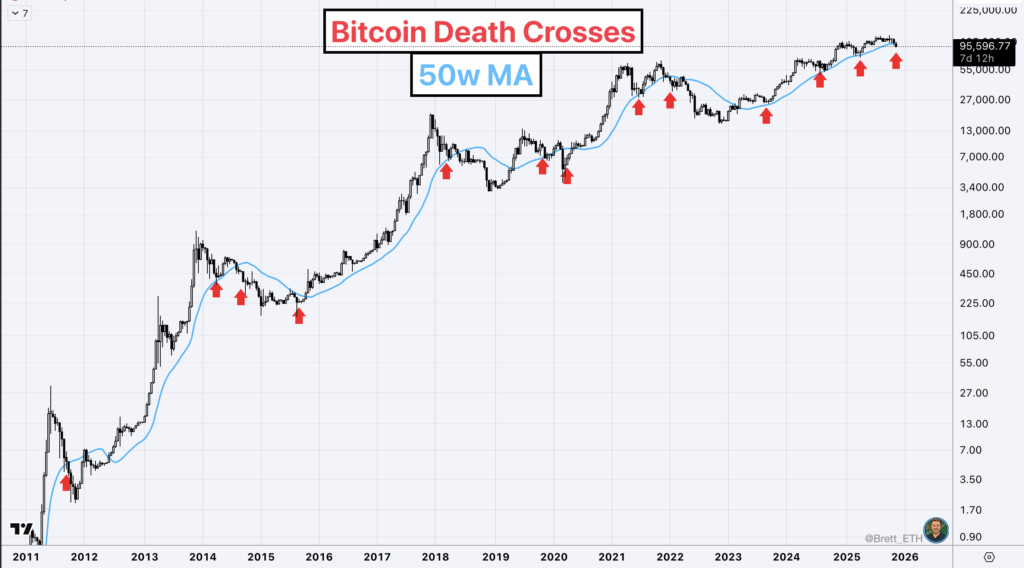
Market analyst Brett observed that Bitcoin is now facing resistance close to its 50-week moving average, which is more significant than the Death Cross. He added that unless a short-term close is achieved above $103,000, a break below this long-term level is most likely.
The previous cycles have indicated that when there were two weekly closes below this level, the top of this cycle was already established. Evidently, Brett also indicated that death crosses within up-market formations have previously led to new highs.
 Source: X
The next level he expects is a possible return to the $103,000 area to retest on a weekly basis. A similar scenario emerged in 2022, where Bitcoin temporarily rose to the 50-week line after breaching it but could not hold on to the trend.
Bitcoin Key Support at $92K Seen as Market Turning Point
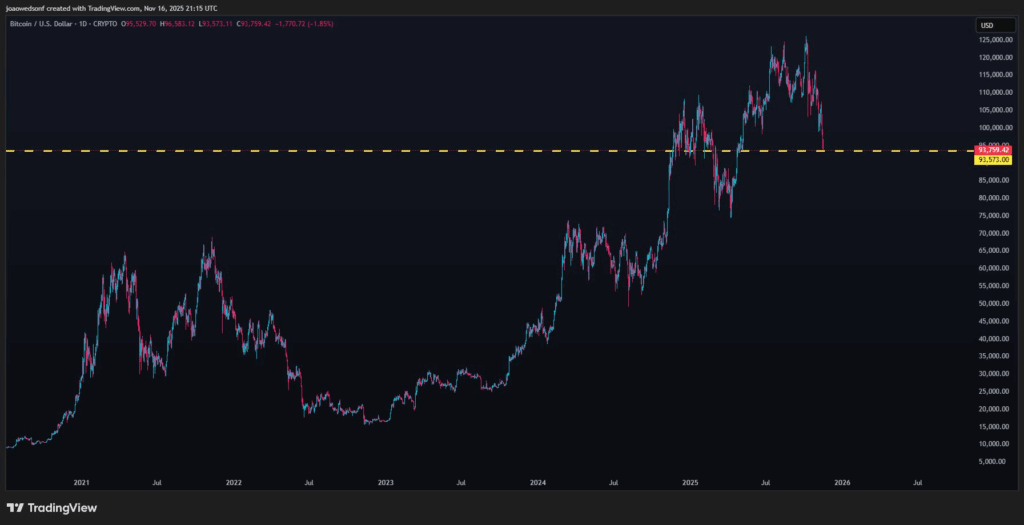
Joao Wedson, Founder & CEO at Alphracta, noticed that Bitcoin is currently back to its starting value in 2025. Joao Wedson added that if this level is broken to the downside, resulting in a breach beneath $92,000, most charts will turn bearish.
 Source: X
It is generally agreed that this is the last opportunity available to market bulls to stabilize markets. Failure to do so could trigger a protracted bear market because on-chain analytics and market risk factors could gradually shift towards bearish markets.
Also Read: Bitcoin Enters Bear Territory With Price Falling Over 20% From ATH
You May Also Like

XRP Price Reality: Ripple CTO Reveals Why Cryptocurrency Valuation Often Diverges from Market Fundamentals

Dow Jones futures steady as Fed tone turns hawkish

