

Ethereum Price Analysis: ETH Holds Above $3700 Amid Bearish Market Signals

Highlights:
- Ethereum price holds above $3700 as bearish grip tightens in the market.
- ETH volume spikes 37% despite its open interest slipping as bulls attempt to regain control.
- The ETH technical outlook shows oversold conditions, with bulls targeting a breakout above $4311 resistance.
The altcoins are experiencing a big blow, including the Ethereum price, which is holding above $3,700. According to CoinGecko, the total market capitalization has fallen 6% within the last 24 hours to $3.76 trillion, after hitting a high of $4.37 trillion on Oct 7.
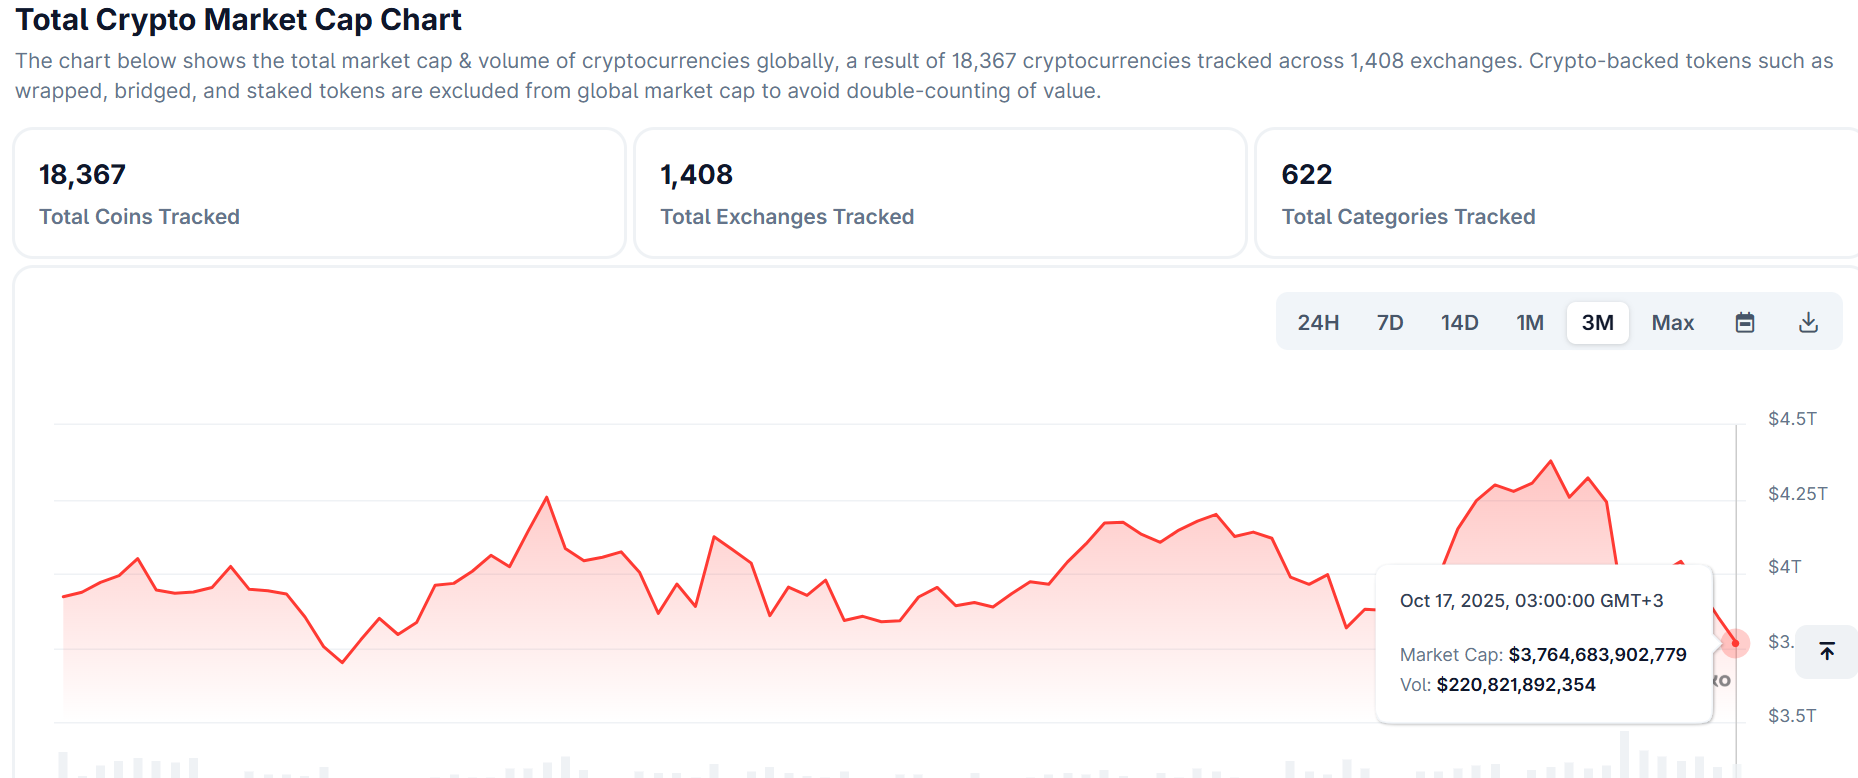 Total Crypto Market Cap Chart: CoinGecko
Cryptocurrency-based assets and other financial instruments like Exchange Traded Funds (ETFs) continue to be greatly hit. This is due to the occurrences of the last week, where the majority of positions were liquidated in an aggressive deleverage process.
Institutional and Retail Dips as Market-Wide Sell-Offs Spike
The Ethereum ETFs are not spared, with outflows as of Thursday averaging 57 million, according to SoSoValue data. The only product to receive inflows was BlackRock ETHA, which had inflows amounting to $47 million, whereas ETH had an outflow of $69 million.
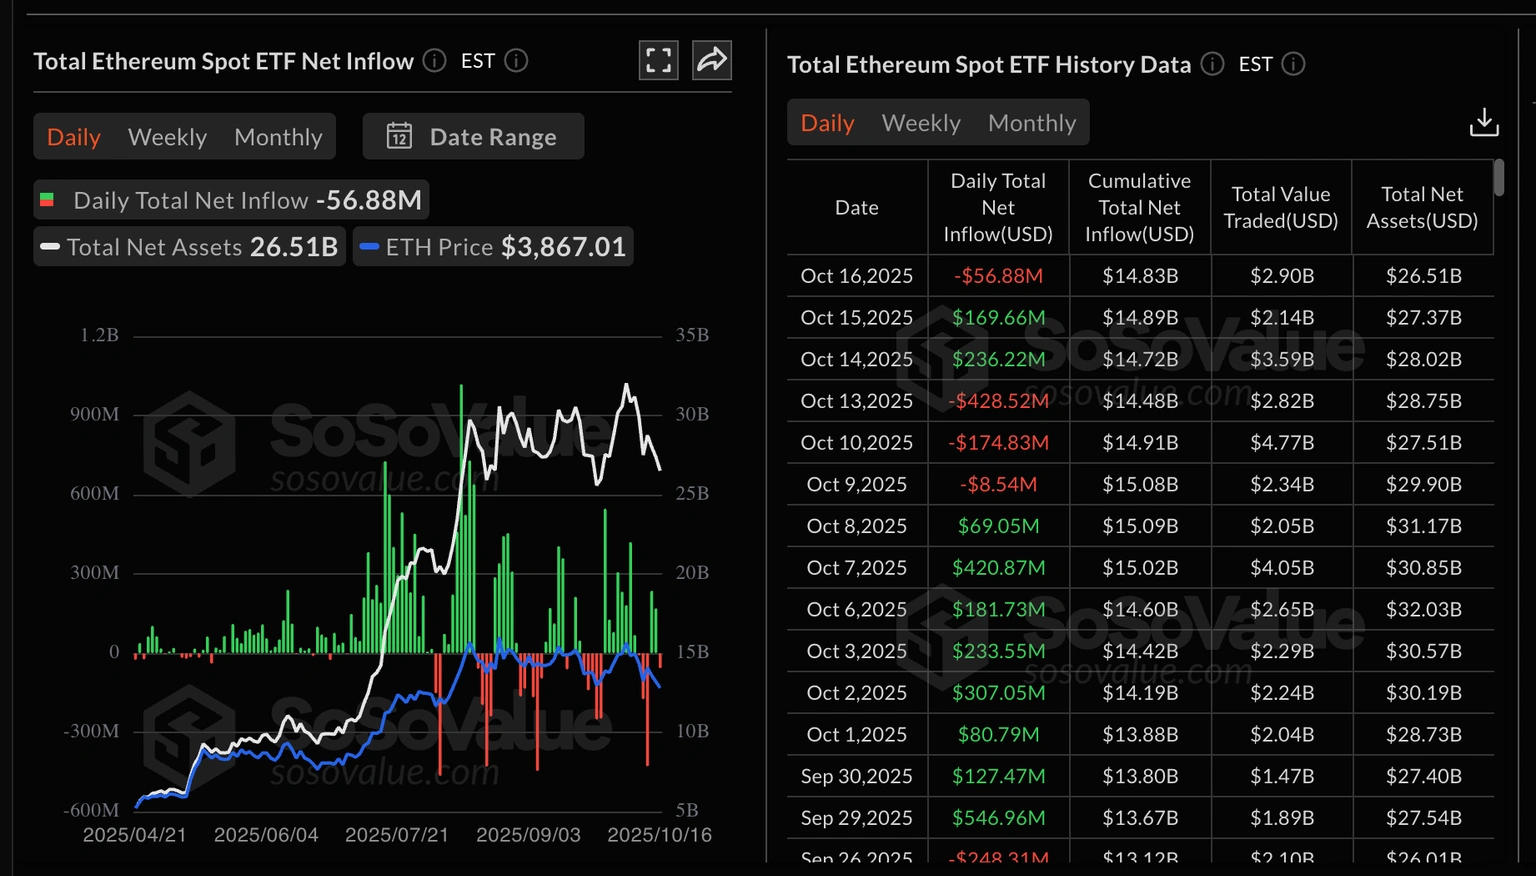 Ethereum ETF Stats: SoSoValue
Meanwhile, the derivatives market data in Ethereum increased by an impressive 37.83% to $129.88 billion. This growth in trading volume would indicate an increased market activity, indicating the increased investor confidence in the Ethereum future.
However, Ethereum’s open interest fell by 6.41% amounting to $43.65 billion. This decline may reflect a measure of caution in the market or a temporary decline in the number of leveraged positions. The overall increase in the level of volume suggests a consistent investor presence.
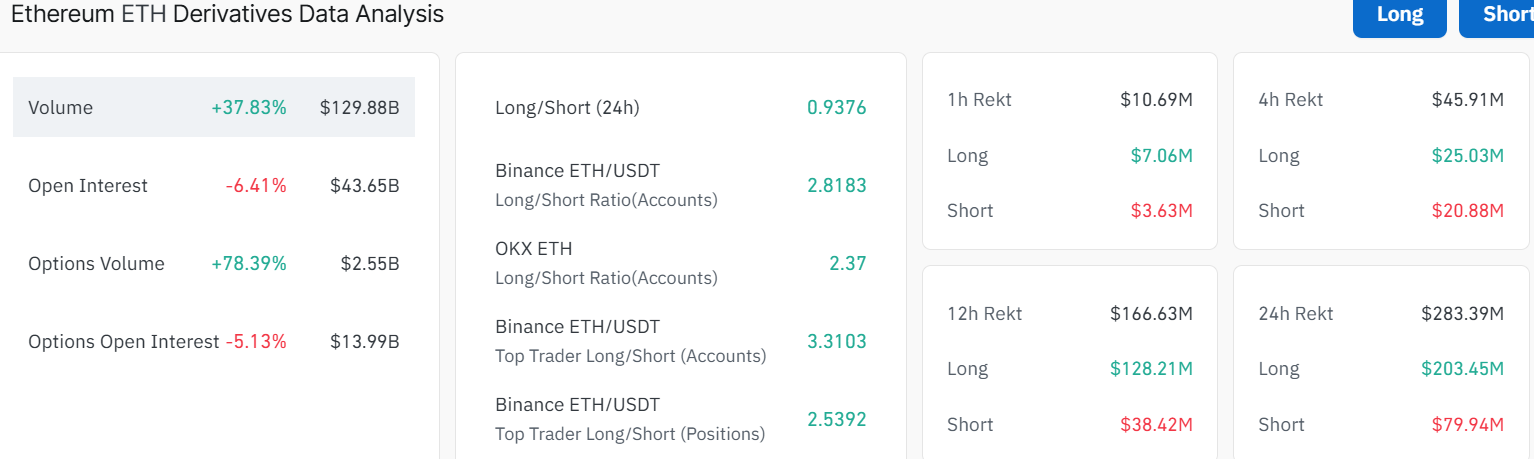 Ethereum Derivatives CoinGlass
Currently, the market sentiment of Ethereum is leaning towards the bulls as the long/short ratio stands at 0.9376. This number shows that although there is somewhat short interest among the parties, most of the traders are placed in a position that would result in a rise in the price of ETH.
Ethereum Price Moves Into Consolidation
The ETH/USD chart paints a vivid picture. The 1-day candlestick setup shows that the price action is in consolidation. The chart shows Ethereum price trading at $3,775, slightly above the $200-day SMA at $3170.
The main support zone now is around $3170. That’s where the bulls might try to flex and hold the line. Meanwhile, the upper resistance hovers near the 50-day SMA at $4311, and a break above could signal a comeback.
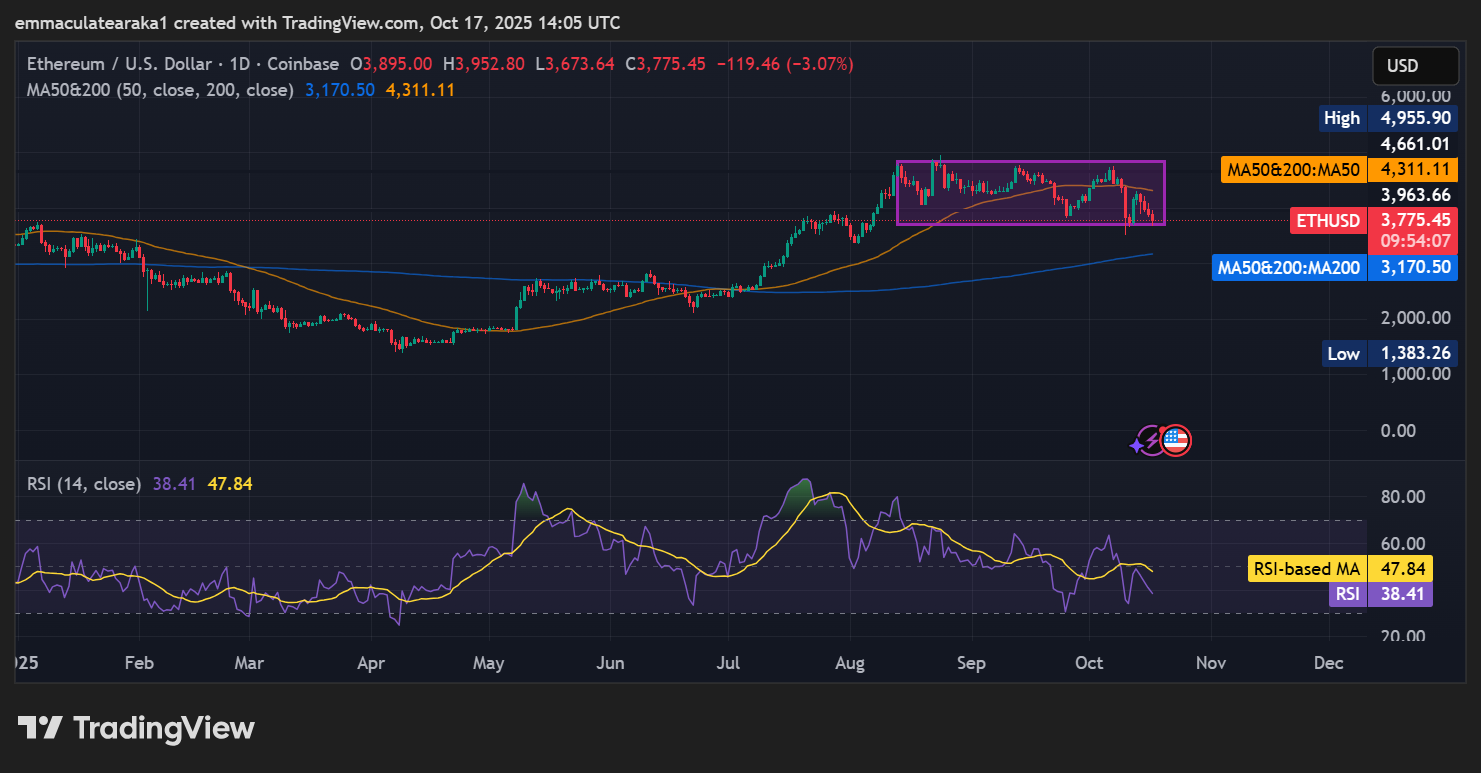 ETH/USD 1-day chart: TradingView
Looking ahead, ETH needs to hold above the $3700 mark to avoid a dip towards the $3519 mark. Conversely, if the market shakes off the bearish outlook, ETH could rip past $4311 and aim for $5000 in the short term. The Relative Strength Index (RSI) at 38.41 shows that the Ethereum price is oversold. In this case, a buy-back campaign will trigger a significant leg up towards the next resistance at $4311.
Overall, the Ethereum price has shown a consolidation pattern, which may act as an accumulation period. If the $3170 support holds and the price breaks above $4300-$4311, a push toward $5000 becomes more likely.
![]()
eToro Platform
Best Crypto Exchange
- Over 90 top cryptos to trade
- Regulated by top-tier entities
- User-friendly trading app
- 30+ million users
![]()
eToro is a multi-asset investment platform. The value of your investments may go up or down. Your capital is at risk. Don’t invest unless you’re prepared to lose all the money you invest. This is a high-risk investment, and you should not expect to be protected if something goes wrong.
You May Also Like

How Moonlander's 1000x Leverage Bet Caught Crypto.com Capital's Attention in the DeFi Race

Coinbase Issues Cryptocurrency Call to US Justice Department: “Solve Urgent Problems!”
