

Containerization Solves ROS 2's Biggest Performance Challenges
:::info Authors:
(1) Tobias Betz, Technical University of Munich, Germany;
(2) Long Wen, Technical University of Munich, Germany;
(3) Fengjunjie Pan, Technical University of Munich, Germany;
(4) Gemb Kaljavesi, Technical University of Munich, Germany;
(5) Alexander Zuepke, Technical University of Munich, Germany;
(6) Andrea Bastoni, Technical University of Munich, Germany;
(7) Marco Caccamo, Technical University of Munich, Germany;
(8) Alois Knoll, Technical University of Munich, Germany;
(9) Johannes Betz, Technical University of Munich, Germany.
:::
Table of Links
Abstract and I. Introduction
II. Related Work
III. Microservice Architecture for an Autonomous Driving Software
IV. Experiments
V. Results
VI. Discussion
VII. Conclusion, Acknowledgments, and References
\
V. RESULTS
A. DDS Communication
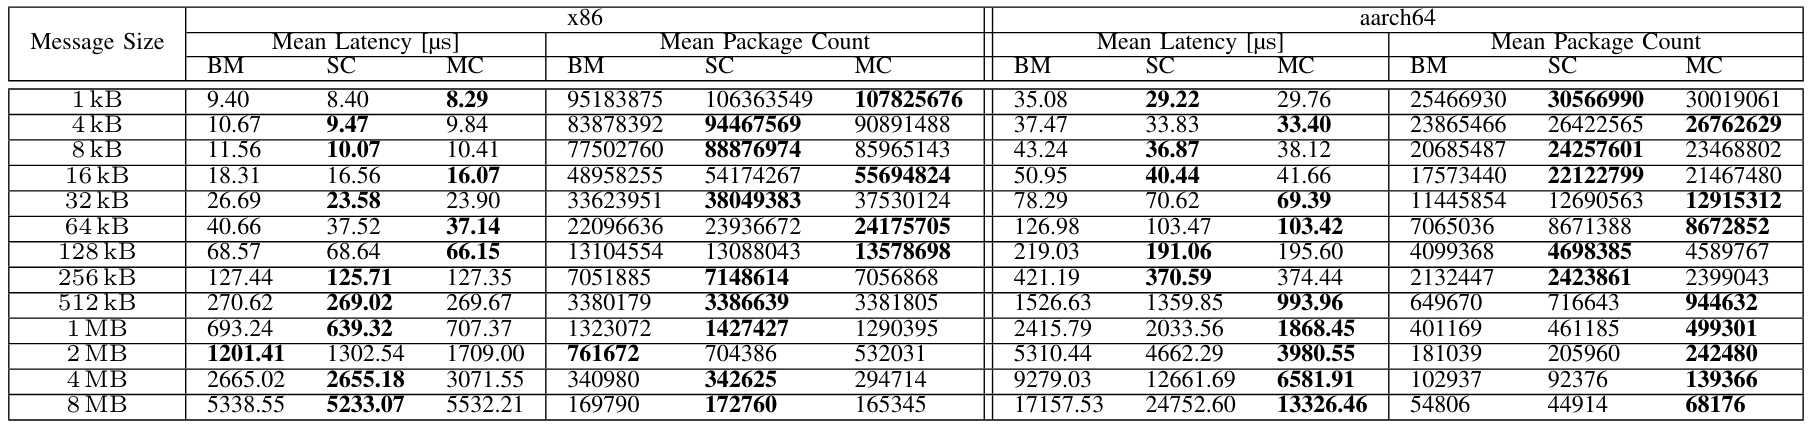
\ The performance benchmark results offer valuable insights into the effects of containerization. As described in Section IV-B1, we used CycloneDDS and measured the round trip latency of specific message sizes and the number of successfully delivered packets. Table IV presents the measured results for both of the compute platforms from message sizes ranging from 1 kB to 8 MB. On both platforms, container-based deployment achieves lower latencies than bare-metal deployment in almost all scenarios. This effect is more evident on aarch64 and particularly pronounced for small message sizes. On aarch64, bare-metal configurations never perform better than containers, while only 2 MB bare-metal messages achieve a lower latency on x86. The latency improvement is more evident on aarch64 than x86. For example, for 1 kB, on aarch64 containers achieve around 15% lower latency (around 8-10% on x86), while for 64 kB, the improvement is even higher (18% vs. 8%). Multi-containers can consistently perform better than single-containers. This is the case for large message sizes on aarch64, where multi-container setups always perform better than single-container starting from 512 kB message sizes. This trend is not confirmed on x86, where single-container setups perform better for large message sizes. In a real application such as the Autoware software stack shown later, the observed message sizes are in the range of 1 kB to 128 kB. This is a range where containerized versions on both systems showed smaller latencies.
\ B. ROS 2
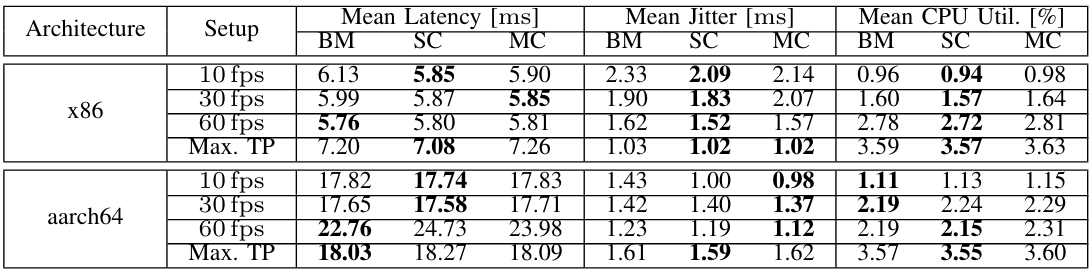
\ We further investigated the combined performance implications of DDS and ROS 2 using ros2benchmark. We present the experimental setup in Section IV-B2. Image data with a size of 0.92 MB is transferred for the data set used. In addition to the pure DDS time, the end-to-end latency now also includes the computation time of the detection algorithm. Therefore, in percentage terms, the DDS time has a much smaller share. Table V shows the measured results of the conducted benchmark. Contrary to ddsperf, latency values in ros2benchmark are very close across all setups. Although containerization can achieve slightly lower latency than baremetal for low fps (10 and 30), bare-metal performs slightly better at 60 fps. Differences in latency are minimal (between
\ 
\ 0.4% and 4.6%). Looking at the jitter shows a reduction due to containerization in almost all cases. For the 10 fps setup, the occurring jitter is reduced by 10.3% for single-container and 8.1% for multi-container. At 60 fps by 6.2% and 3.10%. At maximum throughput, only minor differences occurred. An outlier occurs in the multi-container deployment only in the 30 fps setup. The aarch64 platform also shows this behavior in all setups except for the maximum throughput. At 10 fps, the jitter is reduced by 30.1% and 31.4%. Again, for the other setups, we observe the same behavior. Only the multi-container deployment in the last setup exhibits slightly increased jitter. Overall, we conclude that containerization may lead to a reduction in latency. Additionally, we observe slight differences in CPU utilization. Specifically, for x86, the single-container setup demonstrates the lowest utilization compared to other deployments. Conversely, for aarch64 at lower fps, the bare metal benchmark outperforms the containerized benchmark, while for higher fps, the single-container setup performs the best.
\ C. Real-World Autonomous Driving Application
\ At last, we evaluate the developed multi-container microservice architecture (see Section III) for an autonomous vehicle
\ 
\ 
\ 
\ 
\ 
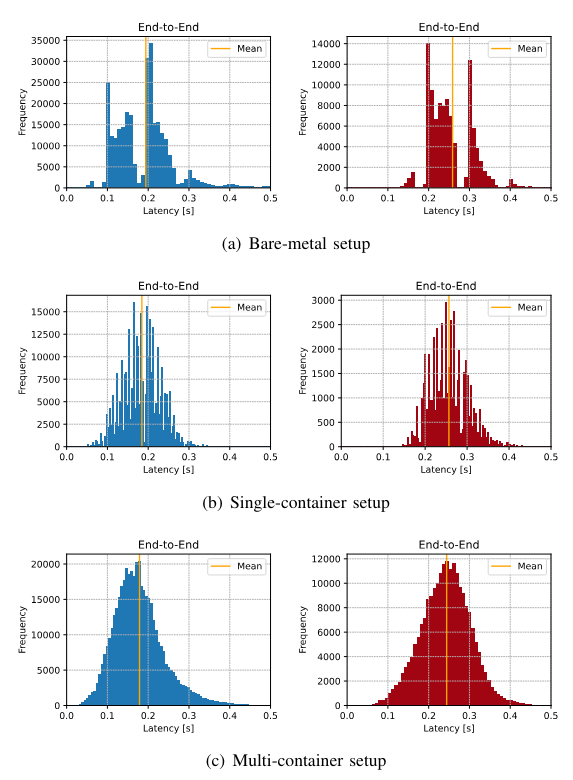
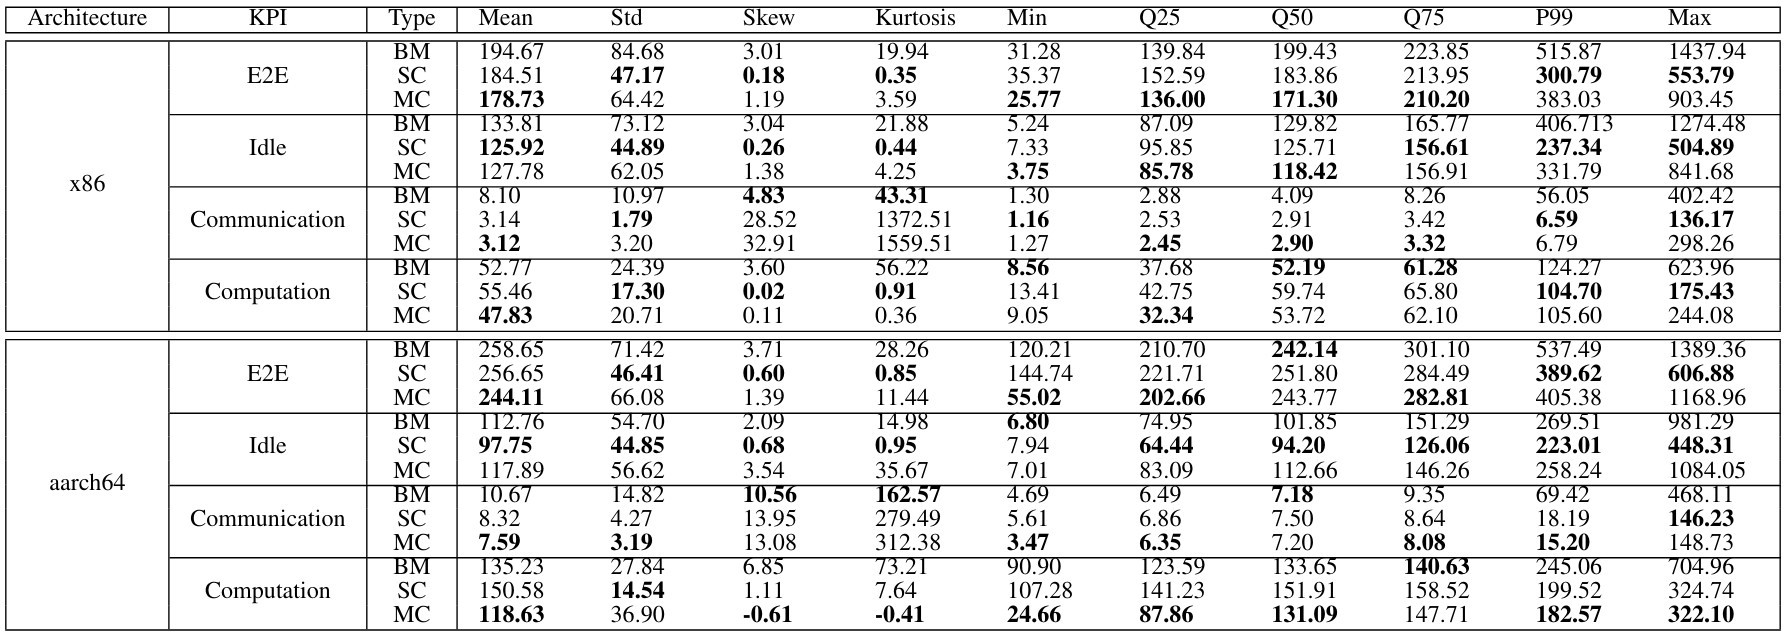
\ and compare it with the bare-metal execution and the execution within a single container. We further split the end-to-end latency into its components (Idle, DDS Communication, Computation) to gain a better understanding of each contribution. Fig. 4 shows histograms of the different deployment variants on the respective compute platforms. Table VI presents the detailed measurement values for the entire experiment. As explained in Section IV-D the latencies are shown for one computation chain from the sensor to the control output.
\ E2E Latency. The histograms of bare-metal deployments (Fig. 4(a)) show a bimodal distribution with (x86) high kurtosis value of 19.94 and a long tail visible in the Q75 and P99 values (Table VI). A similar behavior is evident on the aarch64 system. Instead, for single-containers, we see a reduced standard deviation and a significantly lower kurtosis of only 0.35. This is reflected in the histogram that show a compact distribution.
\ The bare-metal implementation of Autoware on the x86 platform shows an end-to-end latency of 194.67 ms. Instead, for the developed microservice architecture, the mean latency is reduced by 8.1% to 178.73 ms for x86 and by 5.6% to 244.11 ms for aarch64.
\ A relatively large maximum value with 1437.94 ms is measured for bare-metal. In the single-container scenario, this maximum value drops to only 553.79 ms. We also see a reduction in the various quantiles. From 515.87 ms in the 99th percentile to 300.79 ms, which is an improvement of 41.7%.
\ Idle Latency. Looking at the idle latency, which describes the time data waits for processing via a timer callback, we observe the following for x86. The native deployment shows an idle latency of 133.81 ms. Experiments on aarch64 show lower mean (112.76 ms) and maximum values. Executing Autoware in a single-container environment eliminates the two peaks, resulting in a more even distribution for both x86 and aarch64. The mean latency value decreases to 125.92 ms for x86 and 97.75 ms for aarch64, indicating improvements of 5.9% and 13.3%, respectively. This improvement extends to quantile values as well. The 99th percentile sees an improvement of 41.6% to 237.34 ms for x86 and 17.3% to 223.01 ms for aarch64. In the multi-container deployment, the mean idle latency is higher than that of single containers, but still lower than the bare-metal setup for x86. Conversely, a higher measurement value compared to bare-metal is observed for aarch64 (4.5%). For x86, quantiles 25 and 50 are lower compared to single containers, but higher for aarch64. Both systems exhibit increased values for P99 and the maximum.
\ Communication Latency. The communication latency represents the smallest portion of the entire end-to-end latency. On the x86 in the native deployment, this latency has a mean of 8.10 ms, while on the aarch64, it has a mean of 10.666 ms. However, both systems exhibit maximum values of 402.42 ms and 468.110 ms respectively, resulting in distributions with long right tails. Notably, the distribution of the single-container variant shows a reduced tail: the mean DDS latency improves by 61.2% to 3.14 ms for x86, with a smaller improvement (22.0%) observed for aarch64. Both systems also see reductions in their maximum values. In the multi-container variant, DDS values for both systems are similar to those of the single-container setup, with reduced mean and quantile values within a negligible range compared to single-container. Only the maximum value increases slightly to 298.26 ms for x86, still smaller than in the bare-metal deployment. On the aarch64, the maximum value is only slightly higher than that of the single-container setup.
\ Computation Latency. The computation latency is reduced in the multi-container deployment, resulting in improved mean values (47.83 ms for x86 and 118.63 ms for aarch64). These improvements lead to lower values than those observed in both the bare-metal and single-container scenarios. However, we note increased values for P99 and the maximum on the x86 variant. However, the mean values diverge significantly, and the aarch64 system experiences higher values compared to before. The results deviate from a normal distribution, as no clear peak is visible, but rather multiple peaks in both cases.
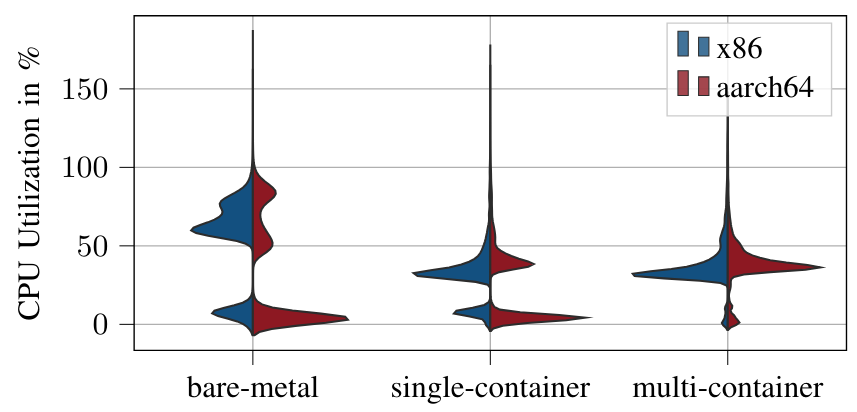
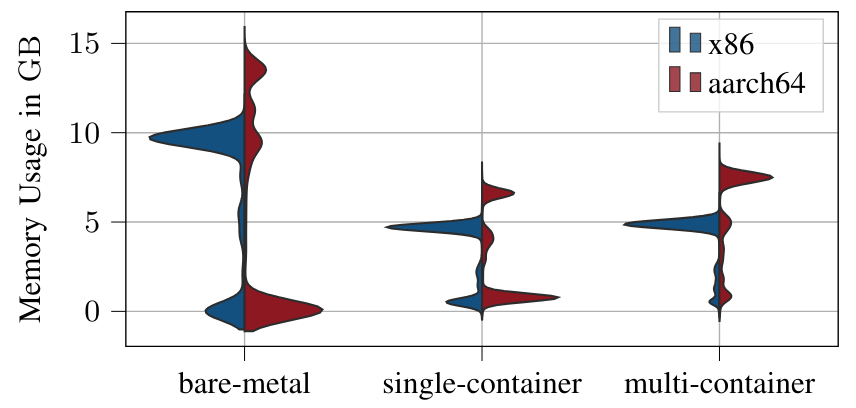
\ CPU and Memory Utilization. Fig. 5 shows the distributions of CPU usage measured over all runs, i.e.,, from the execution of the ROS 2 launch file until the vehicle reaches the target position. We observe the same behavior noted by [24] regarding the startup of the software. With bare-metal and singlecontainer, the mean ramp-up phase of the software lasted 13.60 s and 14.4 s, on the x86. On the aarch64 it is 21.3 s and 23.1 s. Multi-container has a much lower ramp-up phase, where all nodes of the software startup the fastest, 3.8 s for x86 and 4.6 s for aarch64 respectively. This ramp-up phase is clearly visible in both of the plots in the lower part of the graph. As visible in Fig. 5 and Fig. 6, containerized applications, regardless of whether single or multi-container, have a lower CPU and memory utilization. Further analyzing CPU utilization, a significant scatter is observed for baremetal, ranging from approximately 50% to 90% after node initialization. The variance is notably lower for the singlecontainer setup, with a slight difference in utilization, where aarch64 exhibits slightly higher values compared to x86. Regarding memory consumption, bare-metal deployments on x86 cluster at around 10 GB RAM, whereas aarch64 displays higher memory consumption with a significantly higher variance. Once again, transitioning the application to a container environment, whether single- or multi-container, leads to a reduction in memory consumption by almost a factor of two for x86. Similarly, on aarch64, a drastic decrease in memory consumption is observed. However, both container variants still exhibit higher memory consumption compared to the x86 platform, as seen with bare-metal deployment.
\
:::info This paper is available on arxiv under CC by 4.0 Deed (Attribution 4.0 International) license.
:::
\
You May Also Like

CEO Sandeep Nailwal Shared Highlights About RWA on Polygon

👨🏿🚀TechCabal Daily – Folded by a paper cut
