

Solana Price Prediction: Is the SOL Rally Already Losing Steam?
Solana (SOL) is trading close to $80 as of July 6, 2026. The token has held a narrow range for the past week, but on-chain data hints at building pressure.
New wallet growth is speeding up. Exchange balances are shrinking. Traders are watching to see if SOL can break out of its recent slump, and this Solana price prediction breaks down what the data shows.
What is Solana's price today?
SOL is trading at around $80.58 to $80.70, based on data from CoinMarketCap and CoinStats. The 24-hour range has been between $79.71 and $82.30.
Market cap sits near $46.85 billion, with fully diluted valuation closer to $50.77 billion. Daily trading volume is strong at roughly $1.72 billion on spot markets, with futures volume topping $6.58 billion.
|
Metric |
Value |
|
Price |
$80.58–$80.70 |
|
24h Range |
$79.71–$82.30 |
|
Market Cap |
$46.85B |
|
Circulating Supply |
581.13M |
|
Total Supply |
629.72M |
|
24h Futures Volume |
$6.58B |
|
Open Interest |
$5.57B–$5.58B |
Is Solana's network growing in 2026?
Yes. According to on-chain analytics account Ali Charts, Solana added 1.60 million new addresses over the past two weeks, and network growth is speeding up.
That is a sizable jump in new wallets in a short window. This detail matters for any Solana price prediction, since more addresses joining usually points to fresh interest, whether from new users, apps, or bots testing the chain.
Why is SOL leaving crypto exchanges?
It looks that way. The same source reported that $120 million worth of SOL left exchanges over the past week, equal to roughly 1.50 million tokens withdrawn from trading platforms.
When coins leave exchanges, it often means holders plan to store them longer term rather than sell right away. This trend, paired with more new wallets, suggests some accumulation is happening beneath the surface.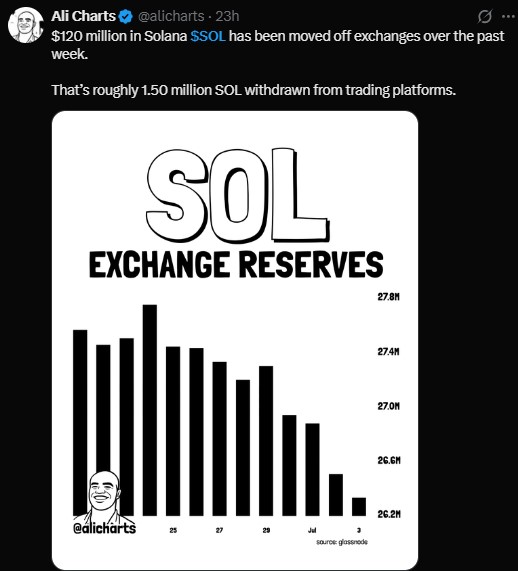
Are SOL traders bullish or bearish right now?
Open interest across Solana futures sits near $5.57 billion, down slightly by 0.09% over the past day. Trading volume, though, rose 12.61% to $6.59 billion.
The long/short ratio on major platforms leans bullish. Binance shows a long/short account ratio of 1.727, and top traders on Binance show a ratio of 1.91. OKX data points the same way, at 1.74.
Liquidations tell a mixed story. Short sellers took the bigger hit over the past day.
|
Timeframe |
Long Liquidations |
Short Liquidations |
|
1h |
$5.56K |
$151.52K |
|
4h |
$911.19K |
$197.84K |
|
12h |
$2.43M |
$3.01M |
|
24h |
$3.97M |
$7.02M |
What does Solana's price chart show?
The daily chart shows Solana forming a rising channel since early June, after a steep drop from highs above $140 earlier this year. Price is now testing resistance near the 100-day EMA around $81.
RSI sits at 61.47, which is neutral to mildly bullish, not yet overbought. The 20-day EMA at $75.87 and 50-day EMA at $76.41 are both below the current price, a short-term positive sign.
Crypto trader Michaël van de Poppe said the setup for Solana remains unchanged. He noted the coin is breaking back into its trading range, with a slight pullback expected before it resumes climbing.
He added that he wants to see the $75 to $77 zone hold as support. If that zone stays intact, he believes SOL could push toward $100 and possibly $120 over the coming weeks or months.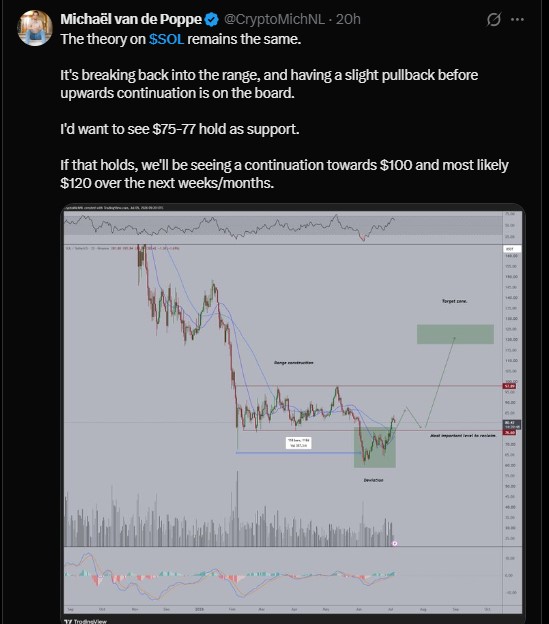
Will Solana price go up or down next?
This Solana price prediction points to a few clear scenarios based on where SOL sits now.
If the altcoin holds above the $75-$77 support zone, a move higher looks possible in the near term.
A clean break above $100 would open the door toward the $120 zone mentioned by analysts.
On the downside, losing the $75 support could send SOL back toward the June low, where the recent rally began.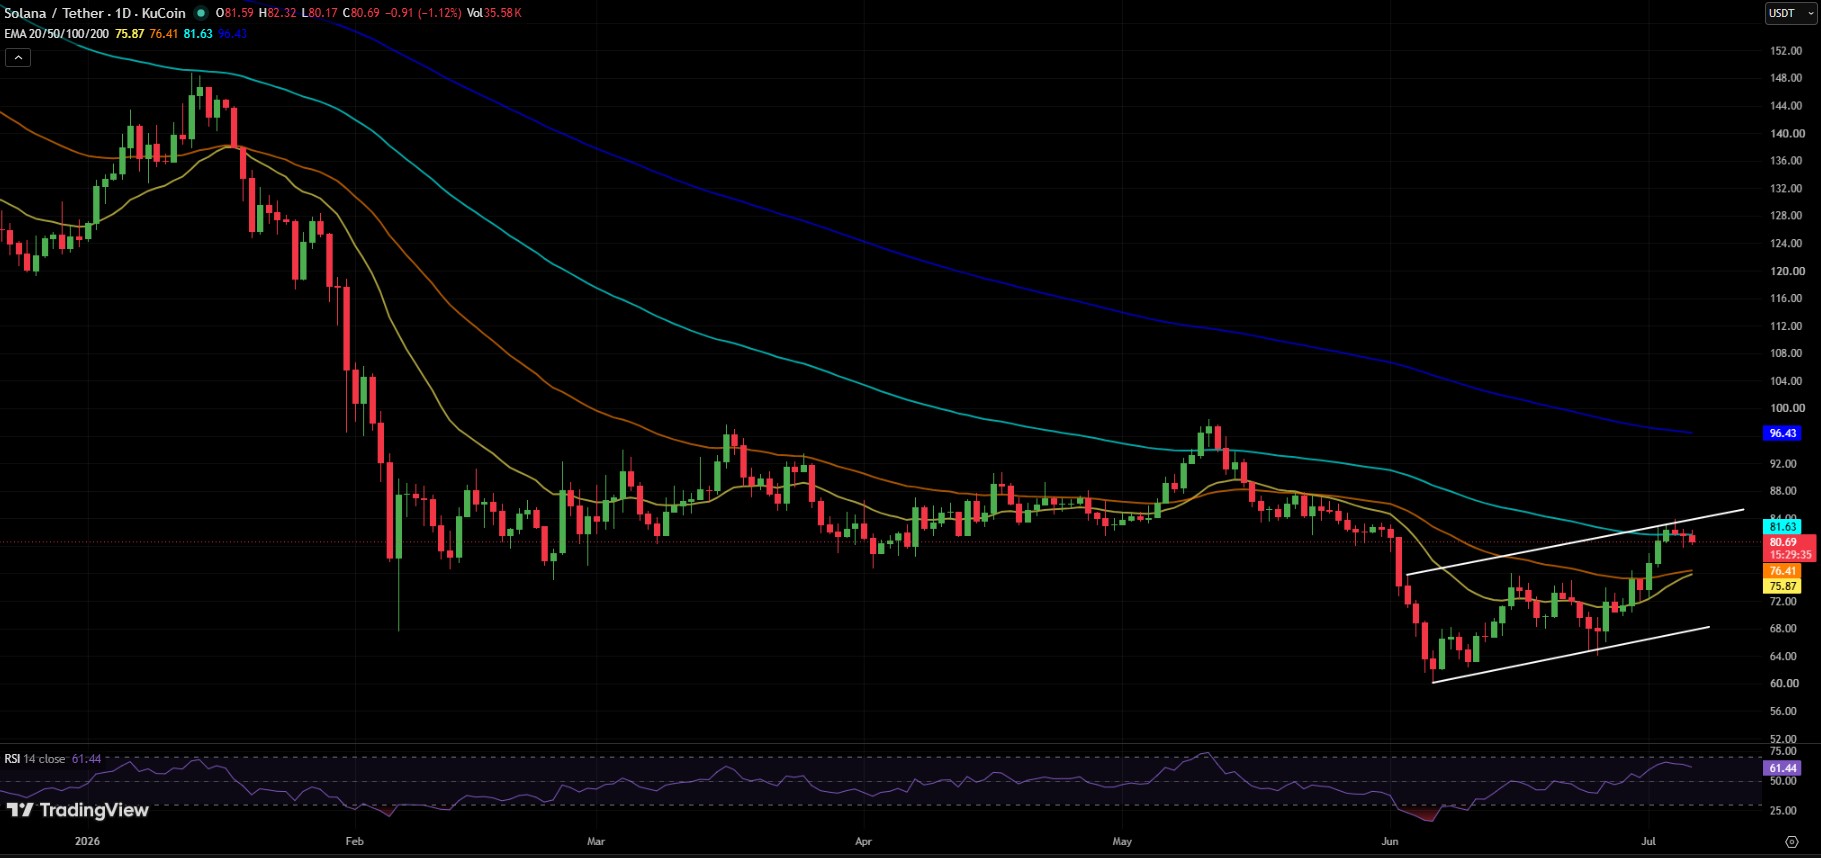
|
Scenario |
Key Level |
Target |
|
Bullish (support holds) |
Above $75-$77 |
$92-$96, then $100 |
|
Strong bullish |
Break above $100 |
$120 |
|
Bearish (support breaks) |
Below $75 |
$60-$63 |
This is not a guarantee. Crypto markets move fast, and macro news, Bitcoin's trend, or a sudden shift in derivatives positioning could change the picture quickly.
Disclaimer
This article is for informational purposes only and does not constitute financial, investment, or trading advice. Cryptocurrency prices are highly volatile and unpredictable. Always do your own research and consult a licensed financial advisor before making investment decisions. Past performance is not indicative of future results.


You May Also Like

Drift Protocol Breach Triggers Up to $285 Million Losses

Trump 'preference' for 'white people' costs him in blistering court ruling
BlackRock’s spot Bitcoin ETF sees over $772 million in outflows! What does this mean for the crypto market?



