

History Says Gold Price Best Months May Be About to Begin: The Chart?
Gold has spent the past few weeks moving lower after reaching a record high, although that pullback may not tell the full story. Fresh chart analysis from Elliott Waves Academy points to a correction that could be nearing its end, and another historical study suggests the strongest part of the year for Gold may only be getting started.
Neither outlook guarantees a fresh rally. Even so, both analyses arrive at a similar conclusion from completely different methods. One relies on Elliott Wave theory, and the other looks at decades of seasonal performance. That combination makes the Gold price worth watching closely over the coming months.
The latest chart from Elliott Waves Academy shows Gold still trading inside what appears to be a large corrective structure after completing a powerful impulsive advance.
A look at the chart helps explain the reasoning. Gold climbed in a clear five wave bullish structure before peaking near $5,602. Elliott Wave analysis often views that type of move as the dominant trend. Since then, the market has entered an A B C corrective pattern, which has pulled Gold back toward the $3,942 region.
The analyst believes this correction remains part of the broader bullish cycle instead of marking the beginning of a major bear market.
The updated Elliott Waves Academy chart also shows two possible support targets for the current decline. The first sits near $4,382, which the analyst labels as the preferred target for Wave 4. Should selling continue, a second support area appears near $3,898, where the correction could complete before buyers return.
One detail stands out on both Elliott Wave charts. Elliott Waves Academy projects that once Wave 4 finishes, Gold could begin another impulsive advance that eventually carries the price above $6,000.
Several key ideas stand out from the Elliott Wave analysis:
- Gold completed a strong impulsive rally before entering the current correction.
- The decline appears to be unfolding as an A B C corrective pattern.
- The first support area sits near $4,382, while a deeper correction could test $3,898.
- Holding those support zones keeps the broader bullish Elliott Wave structure intact.
- A completed Wave 4 could open the door for another rally that targets levels above $6,000.
That technical picture becomes even more interesting when compared with Gold’s historical seasonal pattern.
TheApeOfGoldStreet points out that midterm election years have often followed a similar sequence. Gold usually starts the year strongly before entering a difficult spring period. Weakness often continues into late June or early July.
History then tends to change direction.
The seasonal chart shared by the analyst shows Gold frequently begins its strongest stretch shortly after that period. Historical data indicates August through December has often produced the strongest part of the annual advance.
The analyst argues that current price action closely resembles that historical roadmap. History never repeats perfectly, although the similarities are difficult to ignore.
Gold Price Analysis Shows A Critical Support Zone Could Decide The Next Major Move
The longer term weekly Gold chart also offers another useful perspective.
One feature immediately stands out. Gold spent several years moving sideways between July 2020 and February 2024. That remains the longest period of sustained consolidation visible on the chart.
Once buyers forced a breakout above that range, Gold entered a powerful uptrend that eventually carried the price to an all time high close to $5,600.
Every strong trend eventually experiences its first major correction, and that is exactly what the current pullback appears to represent.
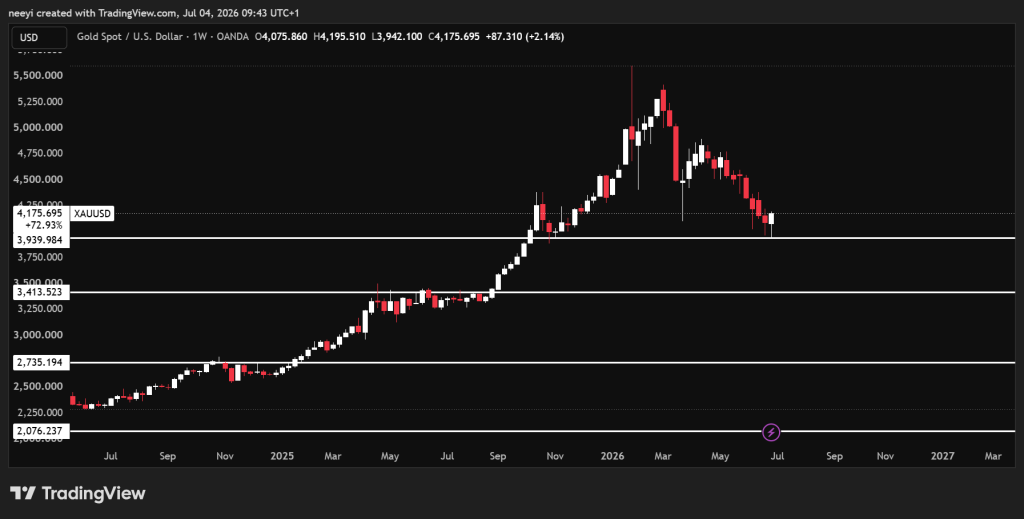 XAUUSD Price Chart / TradingView.com
The first meaningful retracement pushed Gold down toward $3,900, where buyers stepped back into the market. That rebound could become the foundation for another upward move if the support area continues to hold.
Several important price levels deserve close attention over the coming weeks.
Read Also: Gold and Silver Prices Crash May Be Over; Robert Kiyosaki Says a Long Rally Could Be Next
- Holding above roughly $3,900 keeps the bullish structure intact and leaves room for another advance.
- Losing that support could send Gold toward the $3,400 to $3,200 region.
- A break below that zone would expose the next major support near $2,700.
FAQs
Subscribe to our YouTube channel for daily crypto updates, market insights, and expert analysis.
The post History Says Gold Price Best Months May Be About to Begin: The Chart? appeared first on CaptainAltcoin.


You May Also Like

New Framework Aims to Help Sydney Businesses Gain Visibility on AI Platforms Like ChatGPT and Google AI Overviews

Google’s latest ad reimagines the Declaration of Independence with AI — and the internet has thoughts

Bitcoin ETFs Post Best Day in 2 Months Despite $5.4B Annual Outflows


