Pepe Coin price remains in a deep bear market, and on-chain data and its weak technicals point to a crash in the coming weeks or months. Pepe Coin (PEPE) token was trading at $0.000010 on Thursday, Oct. 2, down by…Pepe Coin price remains in a deep bear market, and on-chain data and its weak technicals point to a crash in the coming weeks or months. Pepe Coin (PEPE) token was trading at $0.000010 on Thursday, Oct. 2, down by…

Here’s why Pepe Coin price may miss the Uptober rally

Pepe Coin price remains in a deep bear market, and on-chain data and its weak technicals point to a crash in the coming weeks or months.

Summary
  • Pepe Coin price may not participate in the ongoing Uptober rally.
  • The token has formed a descending triangle pattern on the daily chart.
  • Whale and smart money investors have continued dumping the token.

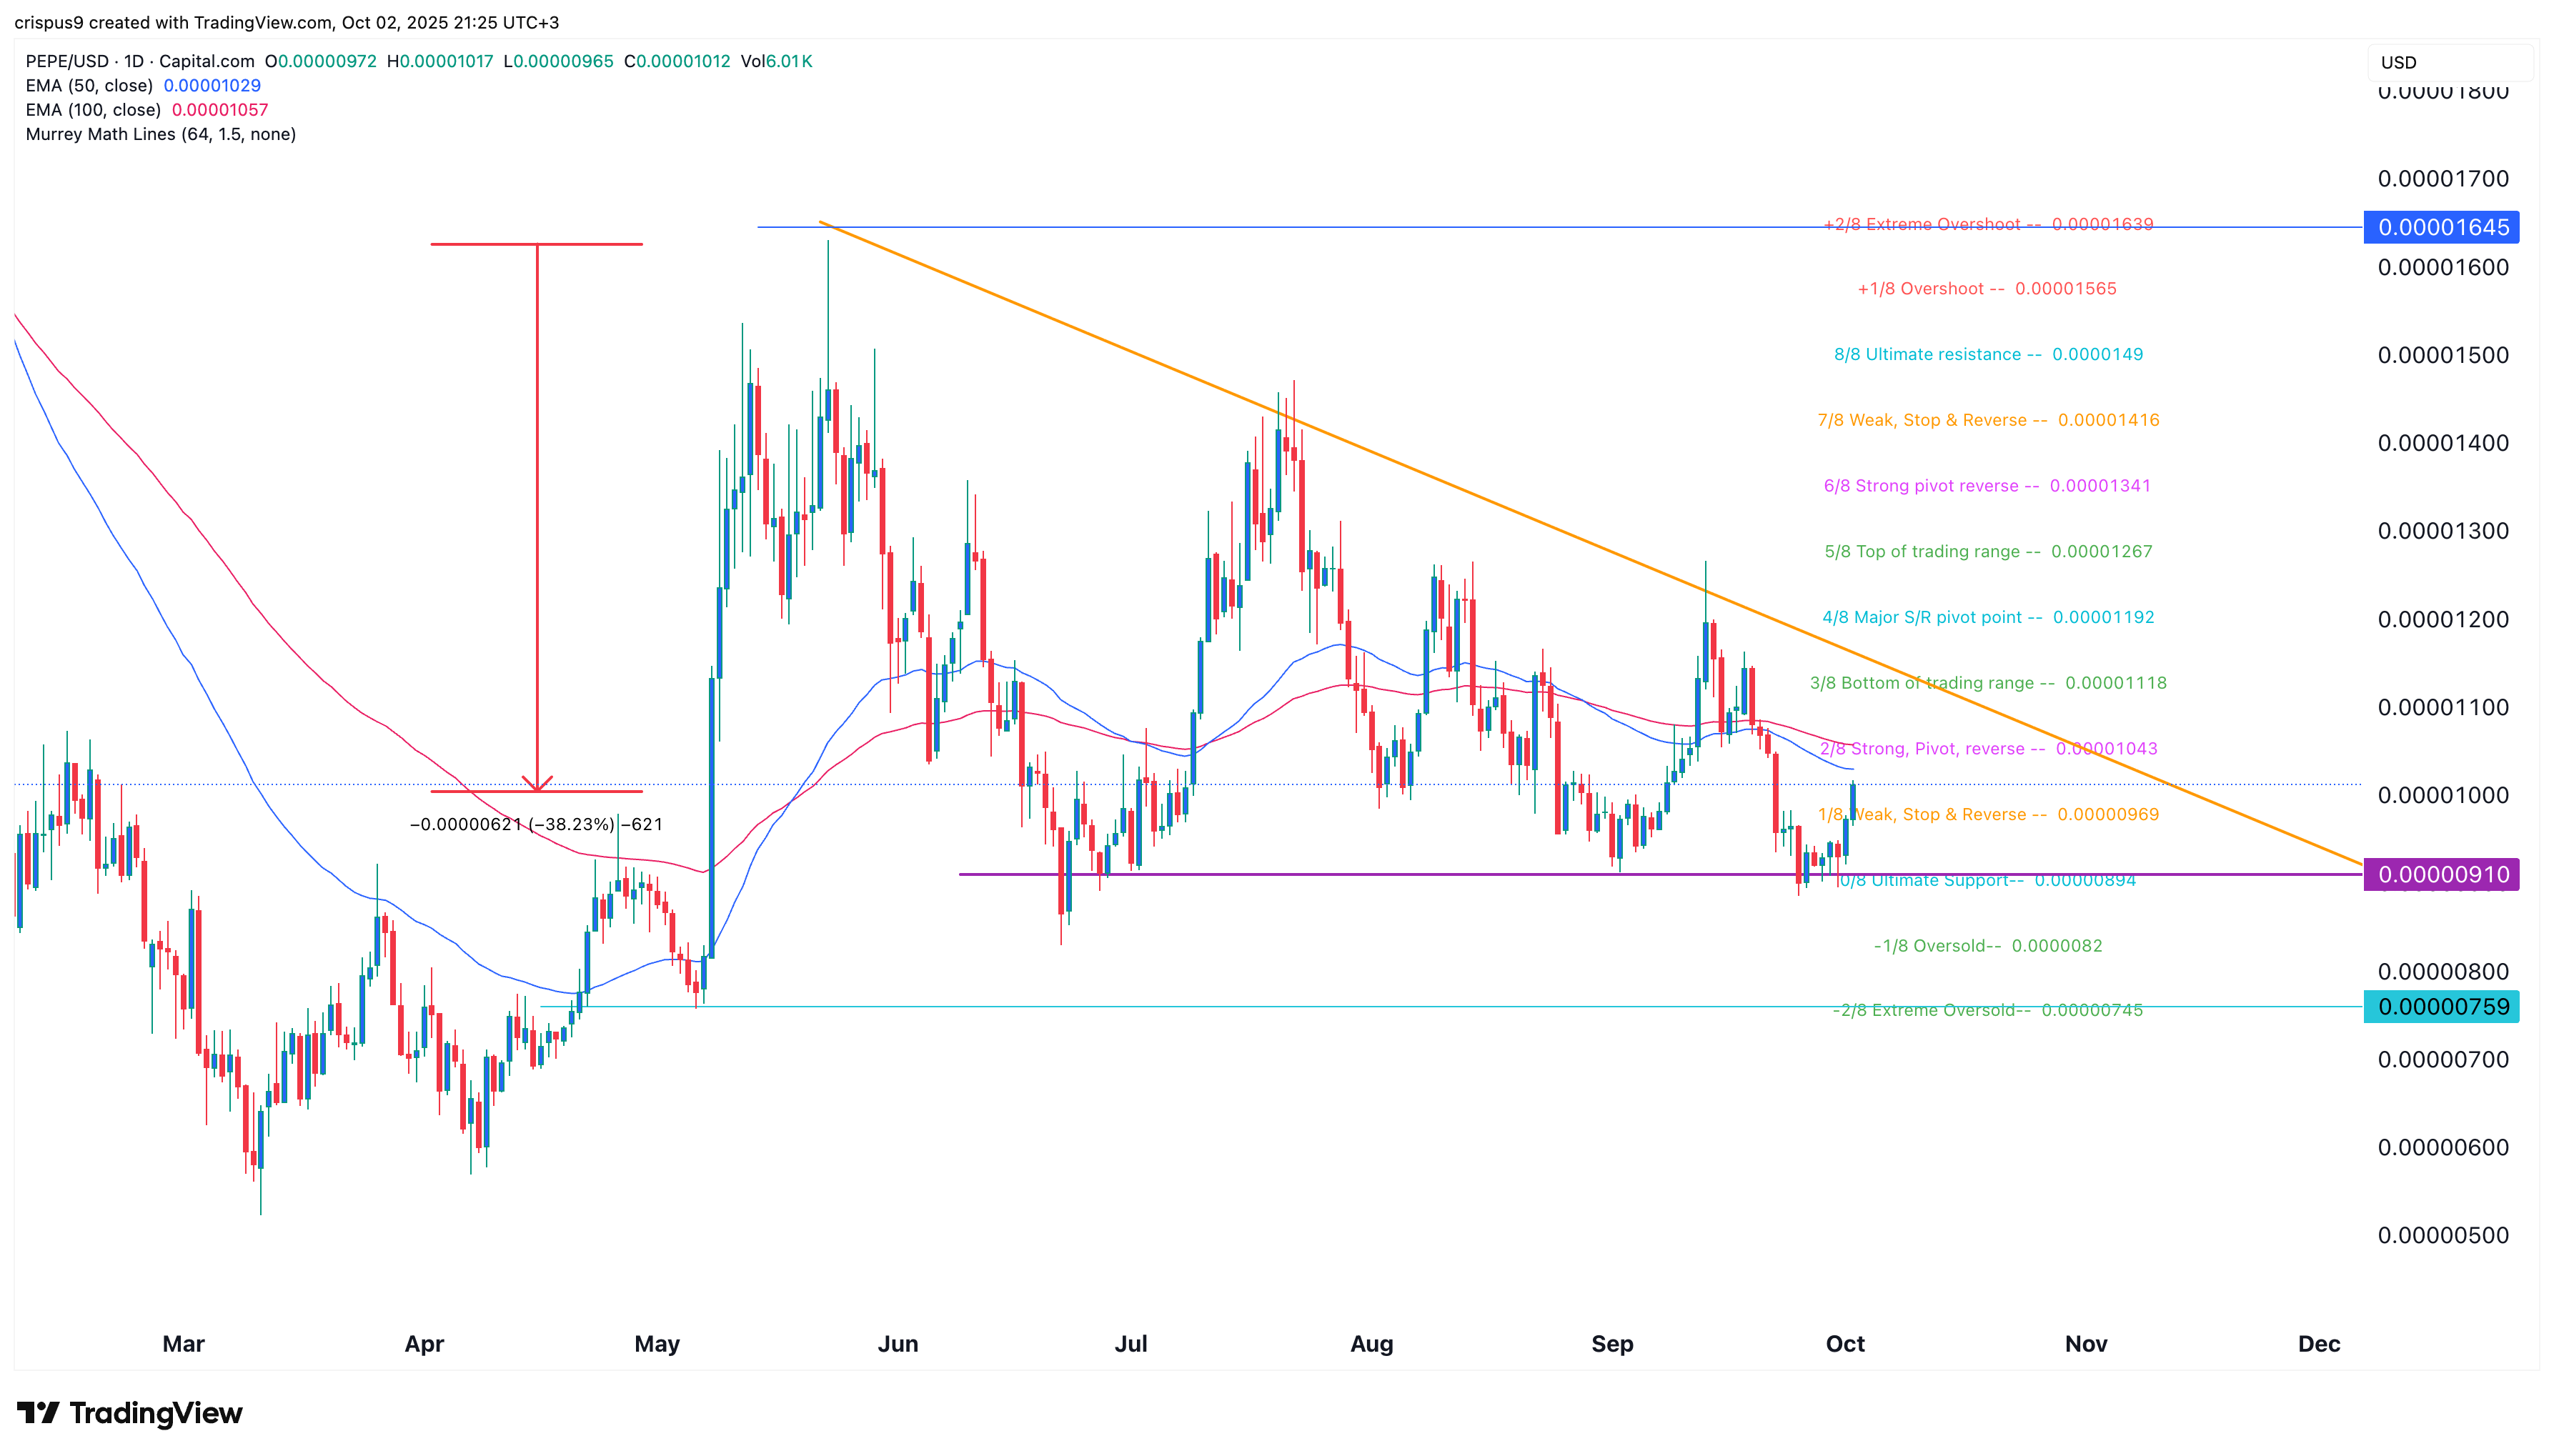
Pepe Coin (PEPE) token was trading at $0.000010 on Thursday, Oct. 2, down by 40% from the highest point in May this year. Its market capitalization has dropped to over $4.2 billion, down from the all-time high of over $10 billion.

Pepe Coin price has technical points to more downsides

The daily timeframe shows that the Pepe price topped at $0.00001645 on May 23 as the crypto market rallied.

Since then, the coin has formed a series of lower lows, with its attempts to rebound facing substantial resistance.

The coin has formed a descending triangle pattern, which consists of a descending trendline and a horizontal support at $0.0000091. The support coincided with the ultimate support level of the Murrey Math Lines tool.

This pattern often leads to a strong bearish breakout, which is normally confirmed when it moves below the support level. If this happens, the next key level to watch will be at $0.00000759, its lowest level in May last year, and the extreme oversold level.

The bearish Pepe price forecast will become invalid if it moves above the descending trendline of the triangle pattern. If this happens, it may rally to the psychological level at $0.000015.

Pepe Coin price

On-chain data shows that whales are dumping Pepe tokens 

Another reason why the Pepe Coin may not participate in the Uptober rally is that whale investors continue to dumb it, a sign that they expect it to keep falling.

Nansen data shows that whale holdings have dropped by 22% in the last 30 days. These investors now hold 6.11 trillion tokens, down from 7.5 trillion on the same day last month. Historically, whale selling is usually a bearish sign.

The same trend is happening among smart money investors and public figures. Smart money investors have reduced their holdings by 65% in the last 30 days to 912 billion tokens, while public figures have cut their holdings by 65%.

Market Opportunity
Pepe Logo
Pepe Price(PEPE)
$0.000005022
$0.000005022$0.000005022
-2.42%
USD
Pepe (PEPE) Live Price Chart
Disclaimer: The articles reposted on this site are sourced from public platforms and are provided for informational purposes only. They do not necessarily reflect the views of MEXC. All rights remain with the original authors. If you believe any content infringes on third-party rights, please contact service@support.mexc.com for removal. MEXC makes no guarantees regarding the accuracy, completeness, or timeliness of the content and is not responsible for any actions taken based on the information provided. The content does not constitute financial, legal, or other professional advice, nor should it be considered a recommendation or endorsement by MEXC.

You May Also Like

Microsoft Corp. $MSFT blue box area offers a buying opportunity

Microsoft Corp. $MSFT blue box area offers a buying opportunity

The post Microsoft Corp. $MSFT blue box area offers a buying opportunity appeared on BitcoinEthereumNews.com. In today’s article, we’ll examine the recent performance of Microsoft Corp. ($MSFT) through the lens of Elliott Wave Theory. We’ll review how the rally from the April 07, 2025 low unfolded as a 5-wave impulse followed by a 3-swing correction (ABC) and discuss our forecast for the next move. Let’s dive into the structure and expectations for this stock. Five wave impulse structure + ABC + WXY correction $MSFT 8H Elliott Wave chart 9.04.2025 In the 8-hour Elliott Wave count from Sep 04, 2025, we saw that $MSFT completed a 5-wave impulsive cycle at red III. As expected, this initial wave prompted a pullback. We anticipated this pullback to unfold in 3 swings and find buyers in the equal legs area between $497.02 and $471.06 This setup aligns with a typical Elliott Wave correction pattern (ABC), in which the market pauses briefly before resuming its primary trend. $MSFT 8H Elliott Wave chart 7.14.2025 The update, 10 days later, shows the stock finding support from the equal legs area as predicted allowing traders to get risk free. The stock is expected to bounce towards 525 – 532 before deciding if the bounce is a connector or the next leg higher. A break into new ATHs will confirm the latter and can see it trade higher towards 570 – 593 area. Until then, traders should get risk free and protect their capital in case of a WXY double correction. Conclusion In conclusion, our Elliott Wave analysis of Microsoft Corp. ($MSFT) suggested that it remains supported against April 07, 2025 lows and bounce from the blue box area. In the meantime, keep an eye out for any corrective pullbacks that may offer entry opportunities. By applying Elliott Wave Theory, traders can better anticipate the structure of upcoming moves and enhance risk management in volatile markets. Source: https://www.fxstreet.com/news/microsoft-corp-msft-blue-box-area-offers-a-buying-opportunity-202509171323
Share
BitcoinEthereumNews2025/09/18 03:50
WTI drifts higher above $59.50 on Kazakh supply disruptions

WTI drifts higher above $59.50 on Kazakh supply disruptions

The post WTI drifts higher above $59.50 on Kazakh supply disruptions appeared on BitcoinEthereumNews.com. West Texas Intermediate (WTI), the US crude oil benchmark
Share
BitcoinEthereumNews2026/01/21 11:24
Fed forecasts only one rate cut in 2026, a more conservative outlook than expected

Fed forecasts only one rate cut in 2026, a more conservative outlook than expected

The post Fed forecasts only one rate cut in 2026, a more conservative outlook than expected appeared on BitcoinEthereumNews.com. Federal Reserve Chairman Jerome Powell talks to reporters following the regular Federal Open Market Committee meetings at the Fed on July 30, 2025 in Washington, DC. Chip Somodevilla | Getty Images The Federal Reserve is projecting only one rate cut in 2026, fewer than expected, according to its median projection. The central bank’s so-called dot plot, which shows 19 individual members’ expectations anonymously, indicated a median estimate of 3.4% for the federal funds rate at the end of 2026. That compares to a median estimate of 3.6% for the end of this year following two expected cuts on top of Wednesday’s reduction. A single quarter-point reduction next year is significantly more conservative than current market pricing. Traders are currently pricing in at two to three more rate cuts next year, according to the CME Group’s FedWatch tool, updated shortly after the decision. The gauge uses prices on 30-day fed funds futures contracts to determine market-implied odds for rate moves. Here are the Fed’s latest targets from 19 FOMC members, both voters and nonvoters: Zoom In IconArrows pointing outwards The forecasts, however, showed a large difference of opinion with two voting members seeing as many as four cuts. Three officials penciled in three rate reductions next year. “Next year’s dot plot is a mosaic of different perspectives and is an accurate reflection of a confusing economic outlook, muddied by labor supply shifts, data measurement concerns, and government policy upheaval and uncertainty,” said Seema Shah, chief global strategist at Principal Asset Management. The central bank has two policy meetings left for the year, one in October and one in December. Economic projections from the Fed saw slightly faster economic growth in 2026 than was projected in June, while the outlook for inflation was updated modestly higher for next year. There’s a lot of uncertainty…
Share
BitcoinEthereumNews2025/09/18 02:59