

Silver Price Forecast: What Comes Next After Silver Falls From January Peak
Key highlights:
- Silver retraces its 38% rally from $65 to $90, now returning to the $66 breakout zone.
- Key support is $65–$67, while resistance levels stand at $70, $75, $80, and $90.
- Silver is trading near a major support level after giving back most of its recent gains from its January peak.
Silver is selling around $66.42 for the futures contract of July 2026. As per the daily chart ranging from February to June 2026, the silver price was rising from about $65 in February up to $75 in April and again to $80 in May and up to $90 in June but subsequently fell down to the middle $60s.
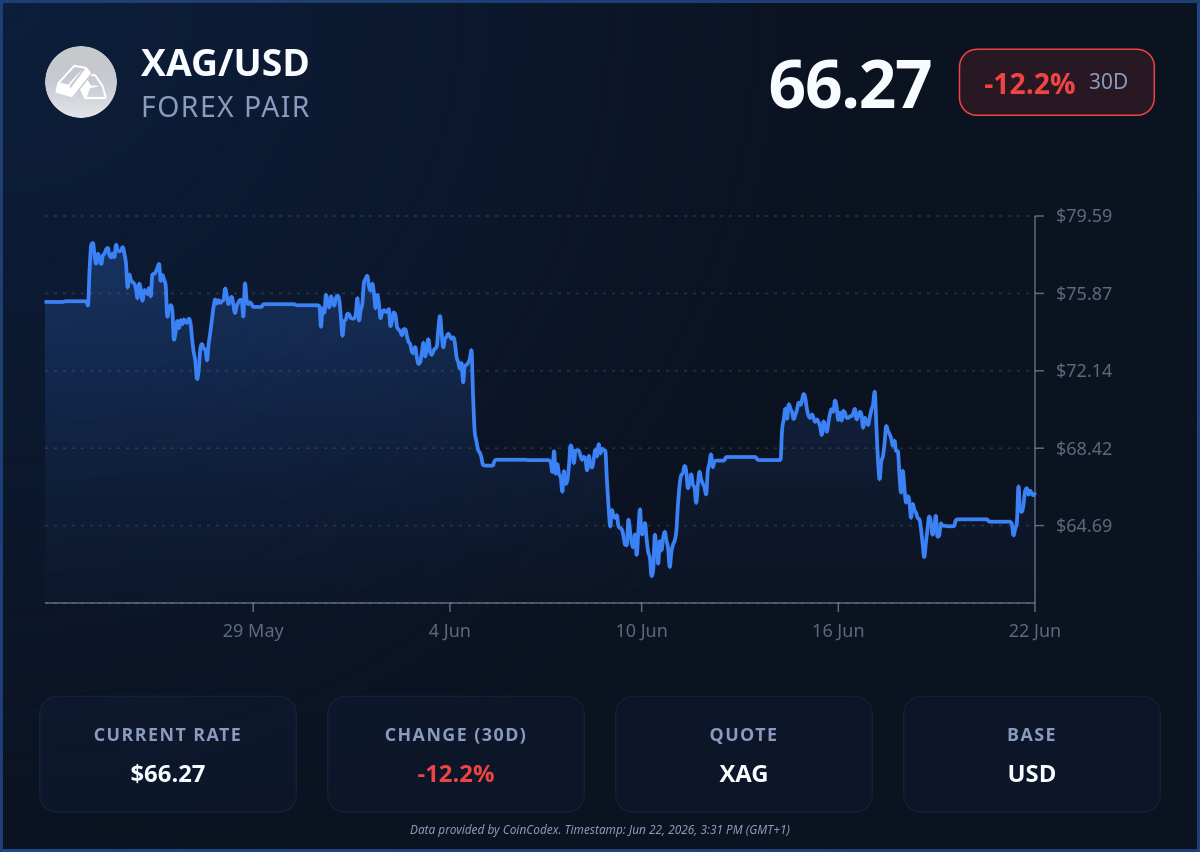
Thus, the entire move depicts a rise of approximately 38% from $65 to $90, and a fall of nearly 26% to the current prices. The silver price is now back near the same area where the earlier rally began, which makes this zone important for traders watching reactions around $65–$67.
How the SOL chart structure looks
We had a look at the silver chart shared by BarChart, and one thing stands out clearly. The move from $65 to $90 was strong, but the rejection from $90 was just as aggressive, sending the price back into the base area.
The current silver price is sitting right above the $65 support level, which has acted as a key floor during this entire move. If that level holds, it keeps the broader uptrend structure alive. If it breaks, the entire rally leg from early 2026 starts to lose strength. Resistance levels above the silver price are clear at $70, $75, $80, and $90.
Here we see an ideal chart pattern consisting of the rise from $65, the breakout at $75, advance towards $80, and the final rally up to $90 prior to the decline. The whole advance phase is retraced down to the mid-$60s area, leaving silver near the former consolidation region.
Silver bigger wave picture and market context
The broader structure shared by MCO Global shows silver placed inside a long-term wave cycle that started from the 2020 lows near $11–12. The current phase is being viewed as a correction within a larger upward cycle.
Fibonacci retracement levels have been depicted by the retracement zones with $60.51 depicting the 38.2% retracement level and $86.21 depicting a 50% retracement from the previous wave.
Silver at $66.42 has approached the lower limit of this retracement zone. This is the zone where the price usually stops in order to decide its future movement. On the upside, recovery above $70 would be the first step toward stabilizing the structure again. A move back above $75 would bring $80 and $90 back into focus. On the downside, below $65, the next levels come in at $60, $55, and $50 based on the chart scale.
Where could the silver price go next?
At present, there are two significant areas of consolidation in the silver prices, being the $65 support level and the $70 resistance level. The ability to hold above the $65 support level will stabilize the price structure and allow for a return to the $70 and $75 price levels. A break below $65 would expose deeper levels around $60 and possibly $55.
The key takeaway is simple. Silver is back at a major decision point after a strong rally and a full retracement of that move. How the price reacts around $65 will likely set the tone for the next phase of direction. According to CoinCodex’s 1-month silver price forecast, the price could move toward $52.40, pointing to potential downside pressure from current levels.


You May Also Like
Goldman hints at Fed’s next interest-rate bet under Warsh

New Bitcoin Wallet Withdraws $104M from Binance, Signaling Long-Term Holding Intent

Sen. Lummis Pushes U.S. to Lead Digital Assets, Warns Against Losing Crypto Control


