

Ethereum Price Today: $1,727 Is All That Stands Between ETH and $1,500

As of June 18, 2026, ETH trades near $1,750, a level painfully familiar to anyone watching recent weeks. The Ethereum price today reflects sustained bearish pressure rather than a decisive breakdown or recovery. Shallow buying interest meets organized selling from higher timeframes, leaving the second-largest crypto asset in structural limbo.
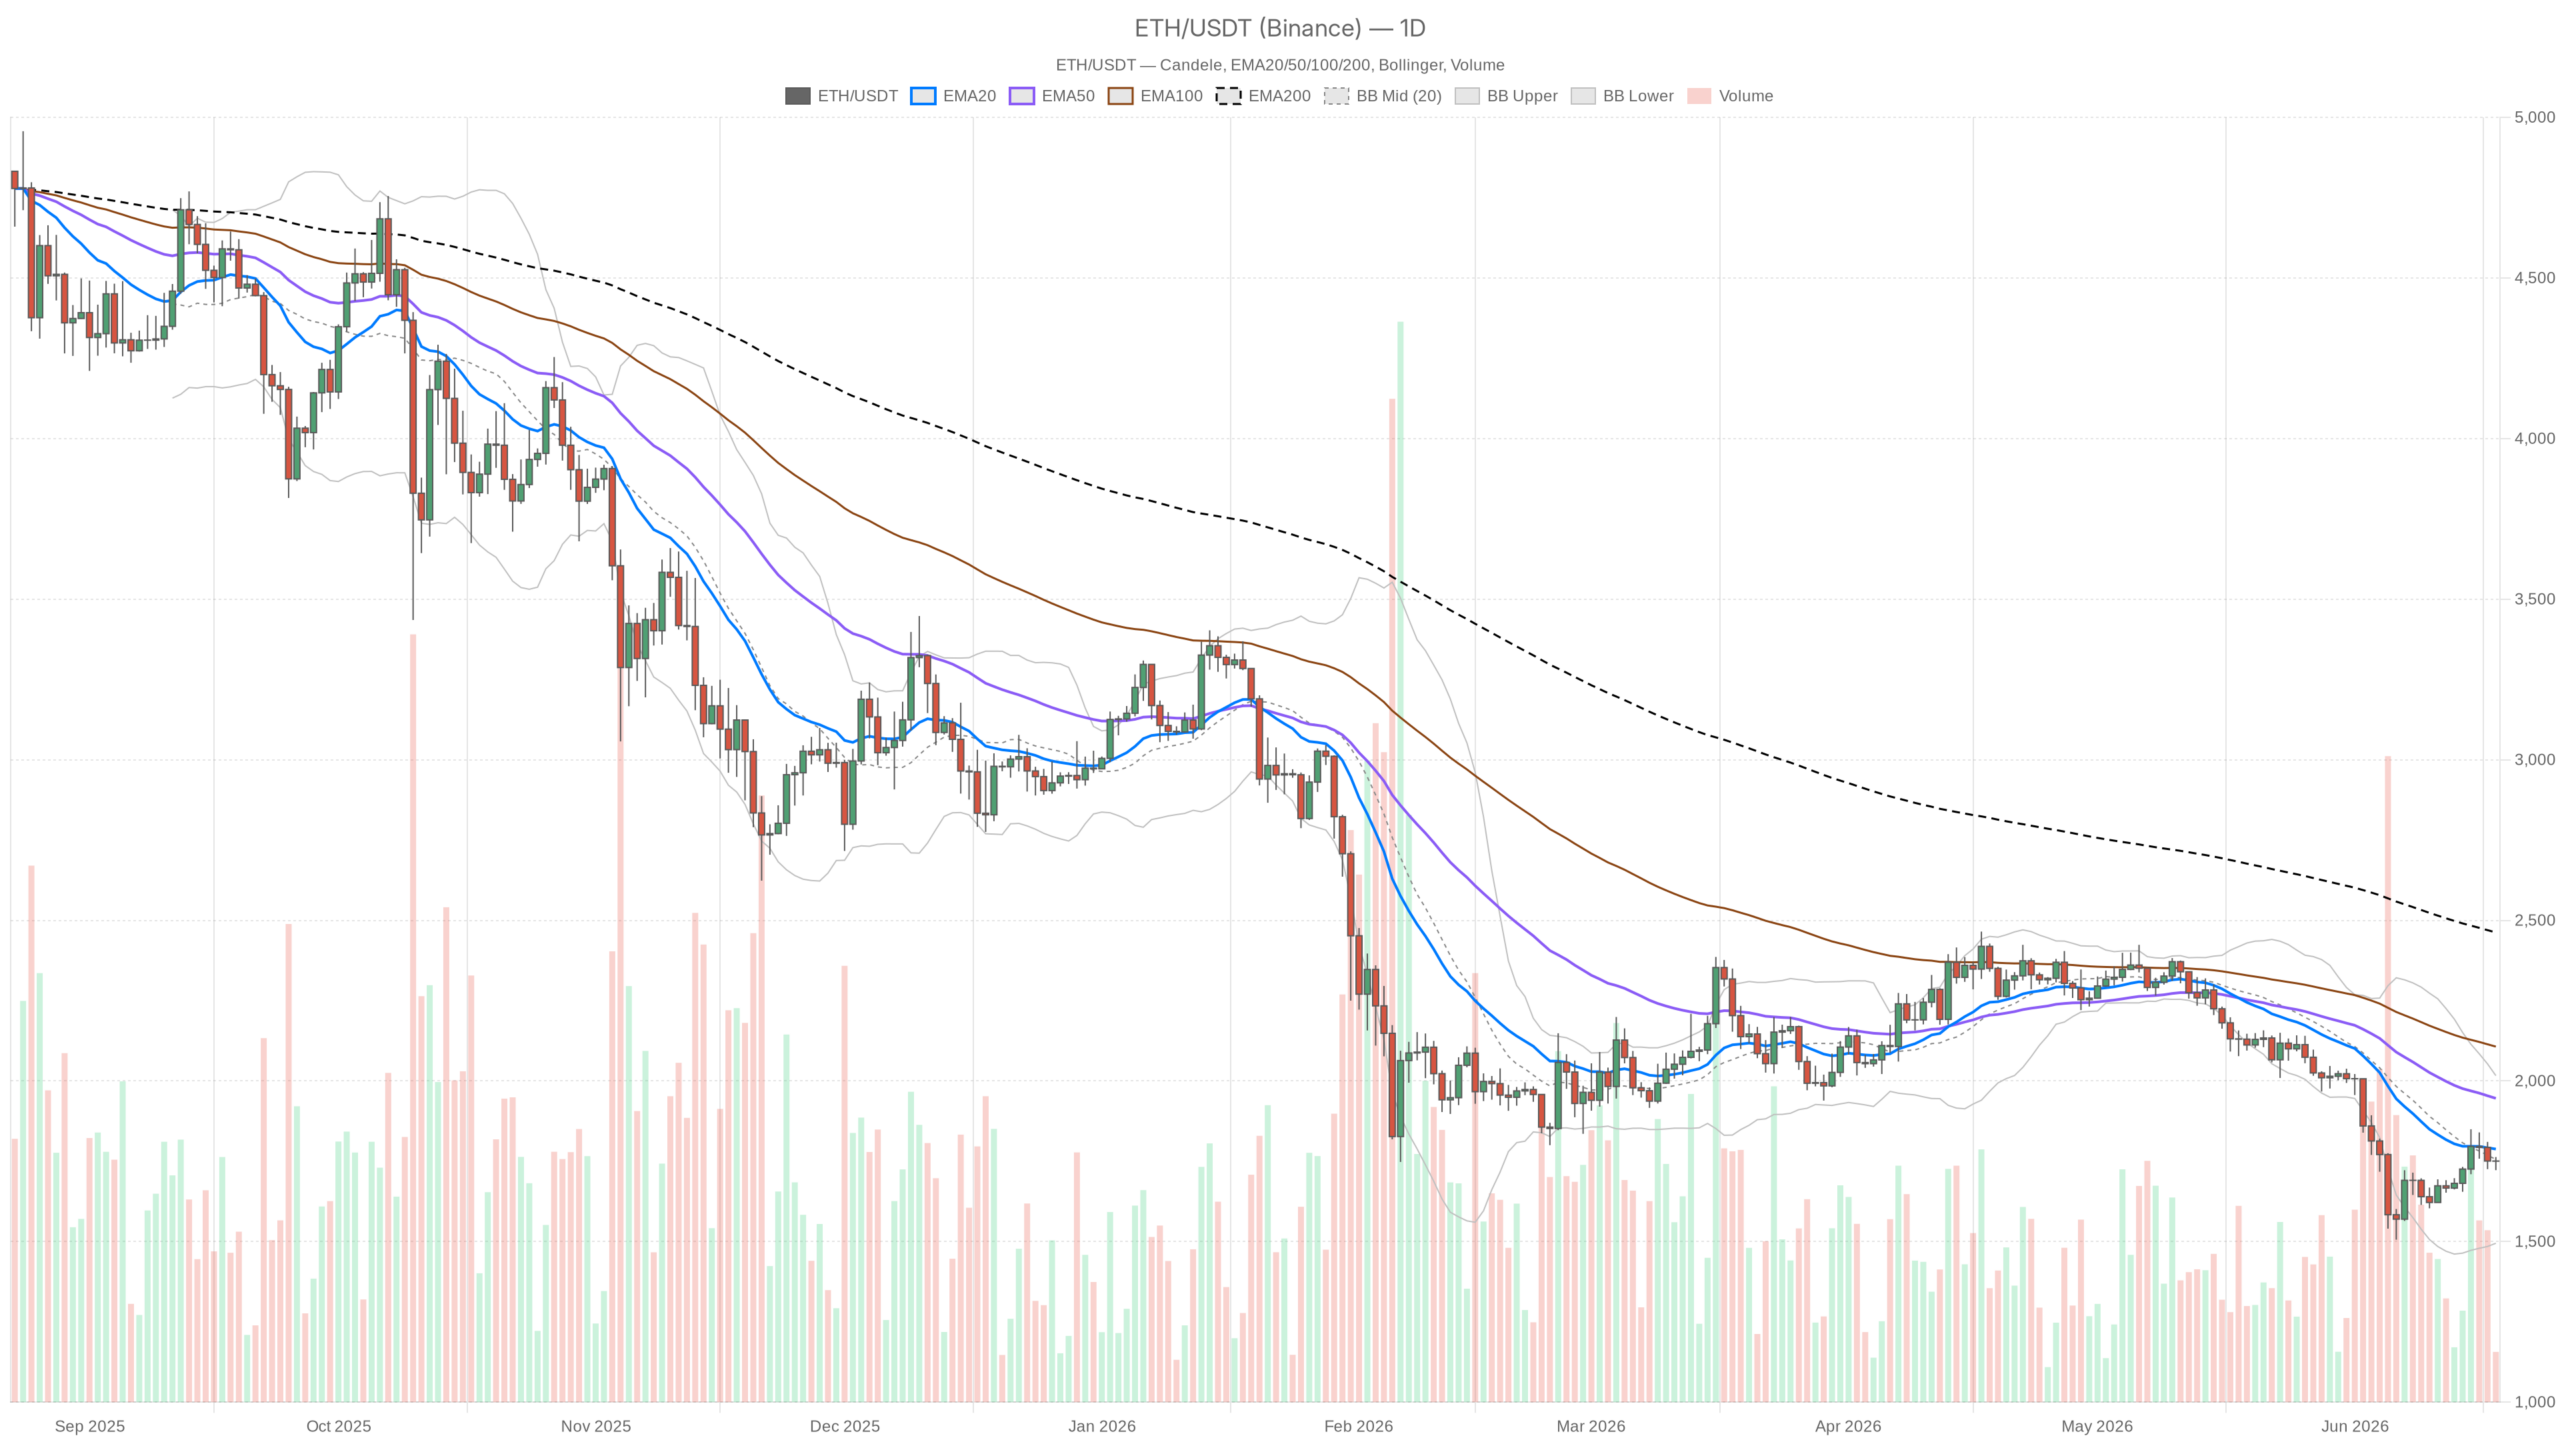 ETH/USDT — daily chart with candlesticks, EMA20/EMA50 and volume.
Key takeaways
- Ethereum trades at approximately $1,750 on June 18, 2026, below both its 20-day and 50-day EMAs
- The daily RSI sits at 41.53, reflecting bearish momentum without signaling capitulation
- The Fear & Greed Index registers 15, deep in ‘Extreme Fear’ territory
- A break above $1,800 on the daily would be the first credible sign of structural repair
- Failure to hold $1,727 opens the path toward the $1,650–$1,500 zone
The Daily Chart: A Bearish Structure That Refuses to Repair
The daily timeframe sets the tone here, and it is not a forgiving one. ETH closed at $1,750.31, sitting below both its 20-day EMA ($1,787.90) and its 50-day EMA ($1,945.77). The 200-day EMA at $2,462.25 is so far overhead it functions less as a target and more as a reminder of how far the asset has fallen. With Bitcoin dominance at 56.1% and the broader market cap sliding, the macro backdrop offers ETH no relief. When price trades below all three major EMAs, you are dealing with a trend, not a correction.
The daily RSI at 41.53 reflects that reality without screaming capitulation. It sits in bearish territory — below the neutral 50 line — but not at the kind of oversold extreme that historically precedes violent bounces. This is the RSI of an asset being slowly sold, not one aggressively dumped. Extreme oversold readings tend to attract bargain hunters; however, a slow grind lower at 41 tends to attract more sellers.
The MACD reinforces this read. The MACD line is negative at -80.4, but the histogram has turned positive at +25.64 with the signal line still more negative at -106.04. That histogram flip is the one mildly constructive detail on the daily, suggesting bearish momentum is decelerating. It is not a buy signal — it is a warning that the selling impulse is losing some urgency. Losing steam and reversing are very different things.
Bollinger Bands on the daily frame show price just below the midband at $1,755.59, which acts as immediate resistance. The upper band at $2,016 is irrelevant under current conditions; the lower band at $1,494 represents the real downside reference if the structure breaks. With a daily ATR of $91.13, a trip toward the lower band sits only about two-and-a-half average daily ranges away. The pivot rests at $1,745.18, with R1 at $1,768 and S1 at $1,727. ETH is barely above its pivot, offering no structural advantage to bulls.
The Hourly Frame: A Flicker, Not a Flame
Step down to the 1-hour chart and the picture softens slightly, though not enough to change the strategic view. Price is essentially flat at $1,750.63, trading around its 1H EMA20 ($1,751.76) and below the EMA50 ($1,760.70). The one note of genuine interest here is that the 1H EMA200 sits at $1,720.11 — well below current price — meaning the broader short-term trend points upward from that deeper moving average. This creates a mild divergence: the daily frame is bearish, but the hourly is technically neutral.
The 1H RSI at 47.42 hovers just south of 50, deep in no-man’s land. The 1H MACD histogram has flipped to a slim positive (+1.21), mirroring the same deceleration of negative momentum visible on the daily. Meanwhile, Bollinger Bands show price sitting almost exactly at the midband ($1,751.25), describing a market in compression rather than directional commitment. The hourly ATR of $12.78 suggests tight, low-conviction ranges intraday. Nothing here says the market is ready to move — it says it is waiting.
The 15-Minute Frame: Short-Term Pulse
The 15-minute chart is the only timeframe where momentum has a genuinely positive tilt right now. Price at $1,750.83 is above both the EMA20 ($1,744.28) and EMA50 ($1,746.70), the MACD histogram is solidly positive at +1.87, and the RSI runs at 59.99 — approaching overbought territory on this short timeframe. The EMA200 on the 15-minute sits at $1,762.39, which is above current price and represents the nearest meaningful overhead resistance.
For active traders, this short-term momentum is execution context, not a thesis. Intraday buyers have a slight edge right now, but the window closes if price cannot push through $1,757–$1,762. Moreover, this micro-level setup must be reconciled against the daily backdrop — where any bounce into $1,787–$1,800 would be selling into a resistance wall, not a breakout.
Market Sentiment: Extreme Fear Speaks Loudly
The Fear & Greed Index sits at 15 — deep inside ‘Extreme Fear’ territory. Historically, readings this low precede relief rallies, because retail capitulation tends to front-run institutional accumulation at value zones. However, extreme fear can also be a lagging indicator of a trend that still has further to run. Given that the daily structure remains bearish without a confirmed reversal signal, treating the sentiment reading as a contrarian catalyst in isolation would be careless.
It is, however, a meaningful input: the market is not complacent, and the marginal seller may be running out of urgency. For anyone tracking the Ethereum price today, this backdrop matters — not as a trigger, but as a reminder that sentiment extremes can persist while the trend continues. That is worth noting even if it is not actionable by itself.
On the DeFi side, Uniswap V3 fee activity jumped 25.6% in the last day and 164% over the past week, per DefiLlama data, suggesting on-chain volume is picking up on Ethereum’s network. That is not a price catalyst, but it does indicate the ecosystem is not dead — users and protocols remain active. Whether that translates into demand for ETH itself remains the open question.
The Two Scenarios Worth Watching
Two distinct paths deserve attention, and which one materializes depends almost entirely on whether bulls can reclaim a single resistance zone in the sessions ahead.
The Bullish Case
The bullish case hinges on a daily close back above the $1,787–$1,800 zone, reclaiming the 20-day EMA and shifting the near-term narrative from failed bounce to potential base formation. A sustained move above $1,800, with the MACD histogram continuing to improve and RSI crossing back above 50 on the daily, would be the first credible sign that the bear structure is being challenged. The invalidation is simple: failure to hold $1,727 on a closing basis opens the door toward the $1,650–$1,500 zone.
The Bearish Case
The bearish scenario is structurally in charge and requires no heroics to play out. As long as ETH trades below its declining EMA stack and fails to recapture $1,800 on the daily, every bounce is a selling opportunity. The immediate trigger would be a break below $1,727, exposing $1,694 and then the $1,494 lower band. Invalidation here would be a decisive, high-volume daily close above $1,870 — the area where the 50-day EMA compression would start to matter.
Positioning Takeaway
Right now, ETH sits in a zone where timeframes tell genuinely different stories: bearish on the daily, neutral on the hourly, mildly constructive on the 15-minute. That kind of disagreement rarely resolves cleanly in one session. The compression between $1,727 and $1,762 is the live battleground — whatever breaks first out of that range with volume will likely dictate the next meaningful move.
The daily ATR of $91 means a resolution, when it comes, will not be small. Volatility is priced in; direction is not. Anyone engaging this market must respect that the macro trend remains bearish, that sentiment extremes can persist, and that a single session of strength on the 15-minute does not cancel weeks of distribution on the daily. Size accordingly.
FAQ
What is ETH trading at right now?
As of June 18, 2026, ETH hovers near $1,750, trapped below key moving averages including the 20-day EMA at $1,787.90 and the 50-day EMA at $1,945.77. The 200-day EMA sits far overhead at $2,462.25.
Why is Ethereum struggling to move above $1,800?
ETH faces sustained selling pressure from higher timeframes, with its declining EMA stack acting as dynamic resistance. The daily RSI at 41.53 confirms bearish momentum, and any bounce toward $1,787–$1,800 encounters a wall of selling interest from traders positioned at higher levels.
Is the Fear & Greed Index at 15 a buy signal for Ethereum?
Not on its own. While extreme fear readings have historically preceded relief rallies, they can also persist throughout extended downtrends. The daily bearish structure needs to show concrete signs of reversal — such as a close above $1,800 — before sentiment alone becomes actionable.
What are the key support and resistance levels for ETH?
Immediate support sits at $1,727 (daily S1), with a breakdown exposing $1,694 and eventually the lower Bollinger Band near $1,494. On the upside, resistance stands at $1,757–$1,762, with the critical zone at $1,787–$1,800 where the 20-day EMA resides.
Disclaimer: This article is for informational purposes only and does not constitute financial advice, an investment recommendation, or a solicitation to buy or sell any financial instrument or cryptocurrency. The analysis provided is not indicative of future results. Investing in crypto assets and financial markets carries a high risk of capital loss. Always do your own research (DYOR) and consult a qualified financial advisor before making any decision.
Article produced with the assistance of artificial intelligence and reviewed by the editorial team.


You May Also Like

Moody’s Assigns First-Ever Rating to Bitcoin-Backed Municipal Bond in Historic Crypto Finance Move

MultiChoice loses 57,000 DStv and Gotv subscribers in Kenya between January and March 2026
Futures Rise, Oil Drops As Market Prices In Iran Deal For Yet Another Day


