

Ethereum (ETH) Faces Critical Test at $1,700 Support Zone Amid Weakening Derivatives
Quick Summary
- Open interest in Ethereum futures has declined by approximately 2 million ETH since the end of May.
- Funding rates continue to fluctuate between positive and negative territory, indicating hesitation from both long and short traders.
- ETH price action remains confined to a narrow range between $1,741 and $1,806, with the 20-day EMA around $1,794 presenting overhead resistance.
- Spot ETF flows reversed to positive territory, though total inflows remained relatively small at $9.6 million on Tuesday.
- Market analyst Ted Pillows highlighted the $1,700-$1,750 range as the crucial support level that needs to hold.
Ethereum (ETH) hovered around the $1,740 level while derivatives markets continued to show signs of weakness following the recent market correction. Current data reveals traders remain hesitant after ETH briefly slipped beneath $1,600 during the first half of June.
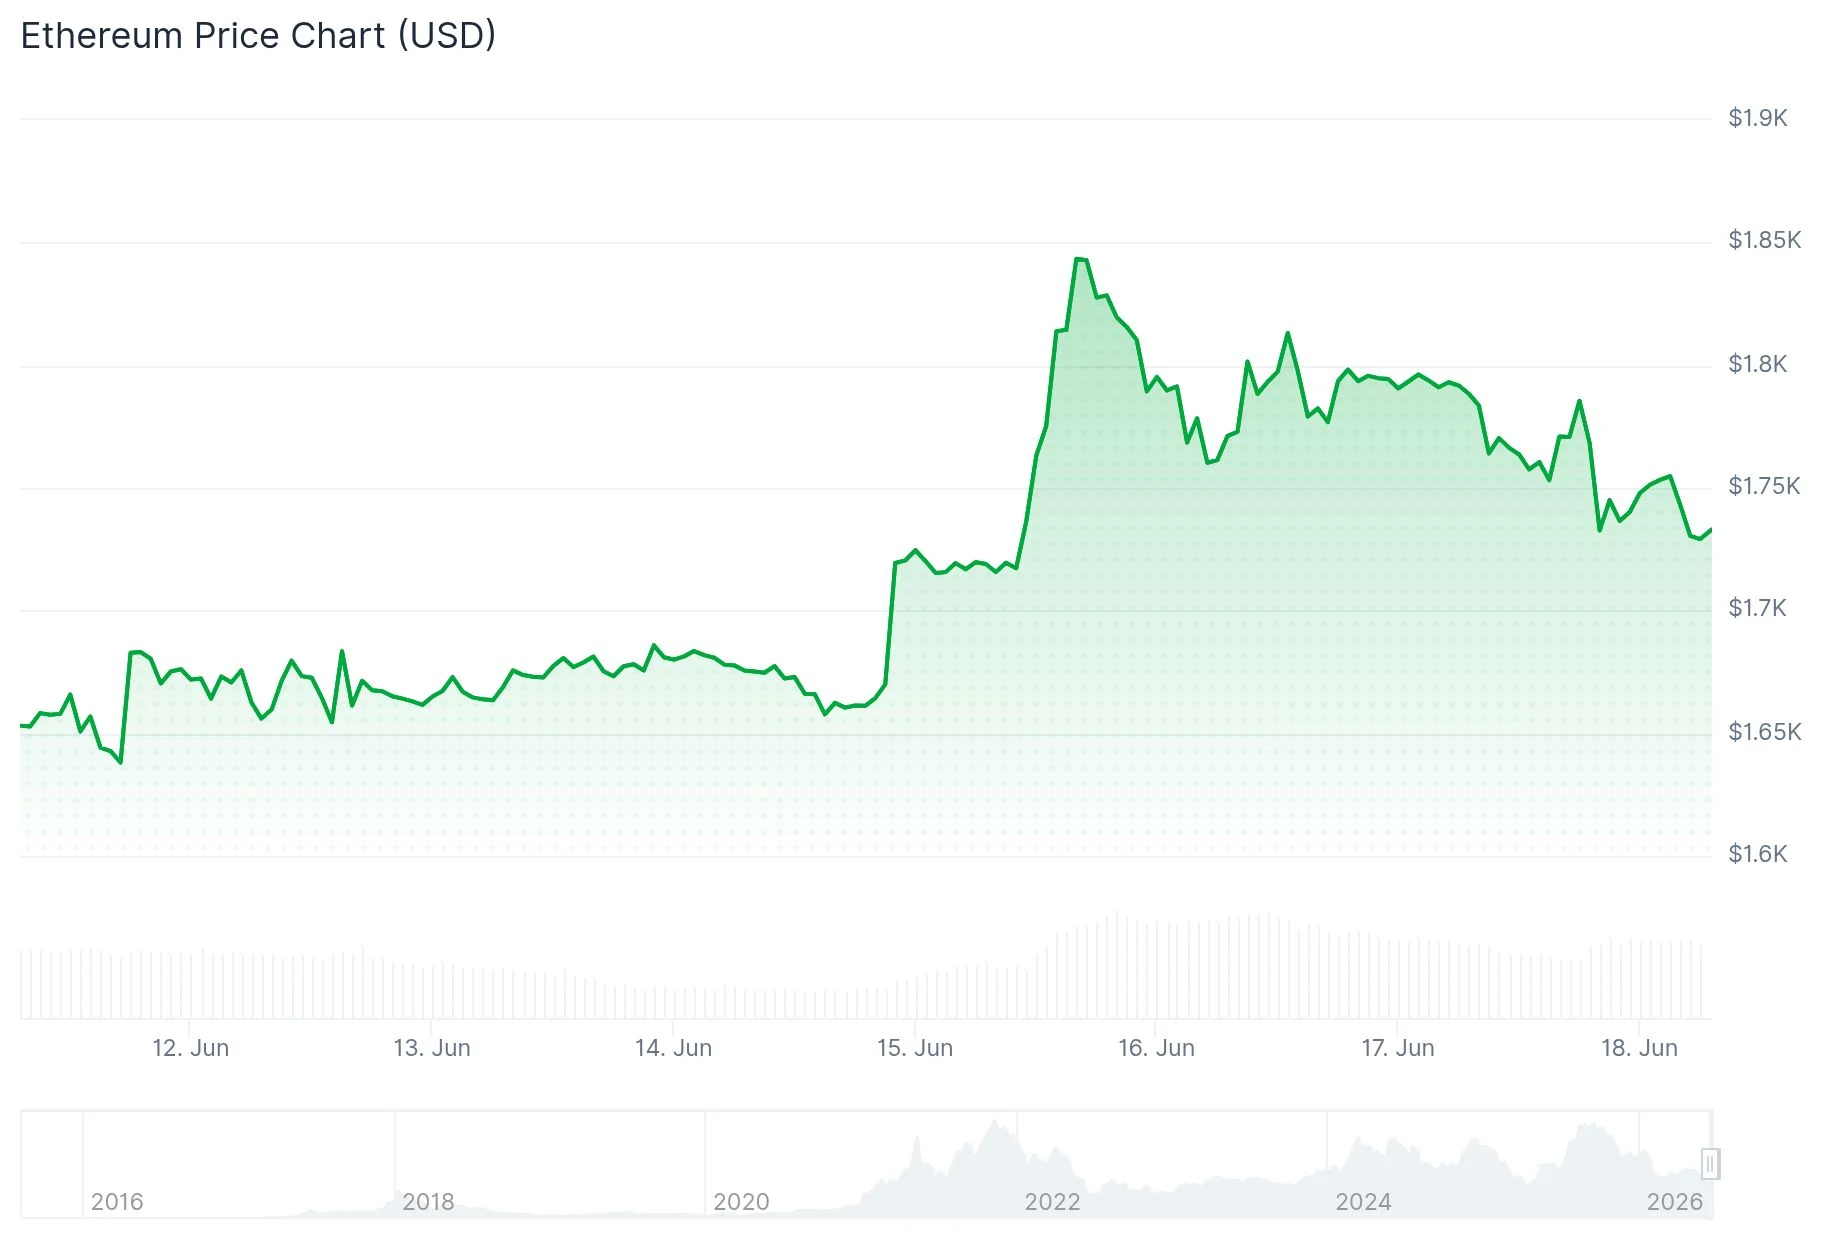 Ethereum (ETH) Price
Open interest in Ethereum futures contracted to 13.64 million ETH by Sunday, marking the lowest reading since the beginning of May. A modest rebound occurred following Monday’s move back above the $1,700 threshold.
From May 28 through the present, Ethereum futures markets have experienced a capital outflow of roughly 2 million ETH, signaling a defensive posture among leveraged market participants.
Funding rates have similarly painted a picture of indecision. Throughout the last fourteen days, these rates have oscillated between negative and positive values.
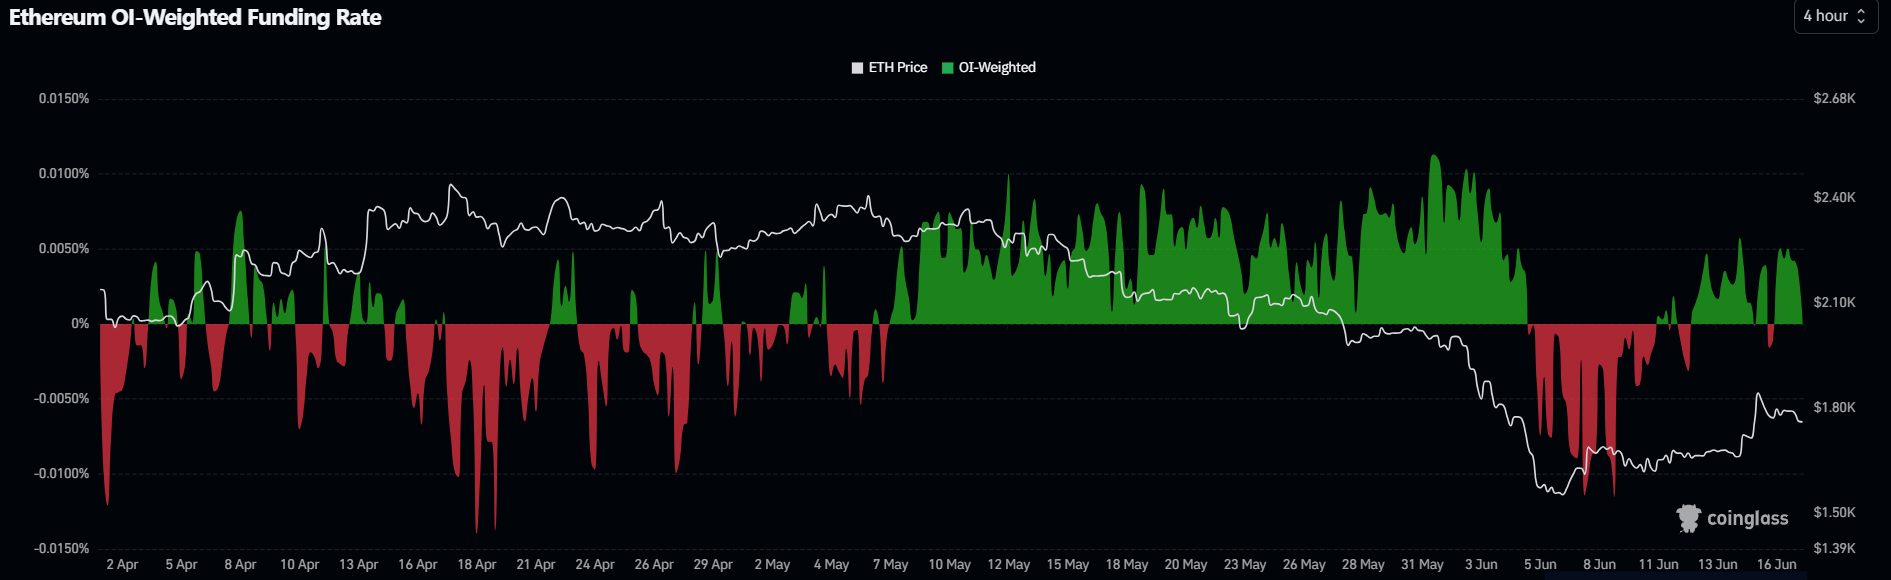 Source: Coinglass
This oscillating behavior indicates neither bullish nor bearish traders have established dominance. The pattern emerged after substantial long position liquidations swept through markets during the final days of May and early June.
Meanwhile, spot exchange reserves experienced a marginal decline during the last forty-eight hours. US-based spot Ether ETFs recorded their second consecutive day of positive flows, bringing in $9.6 million on Tuesday.
Multiple Resistance Levels Cap Upside Potential
Despite this marginal improvement in flows, the broader dataset continues to reflect lackluster conviction. Neither retail participants nor institutional investors have demonstrated a decisive directional bias.
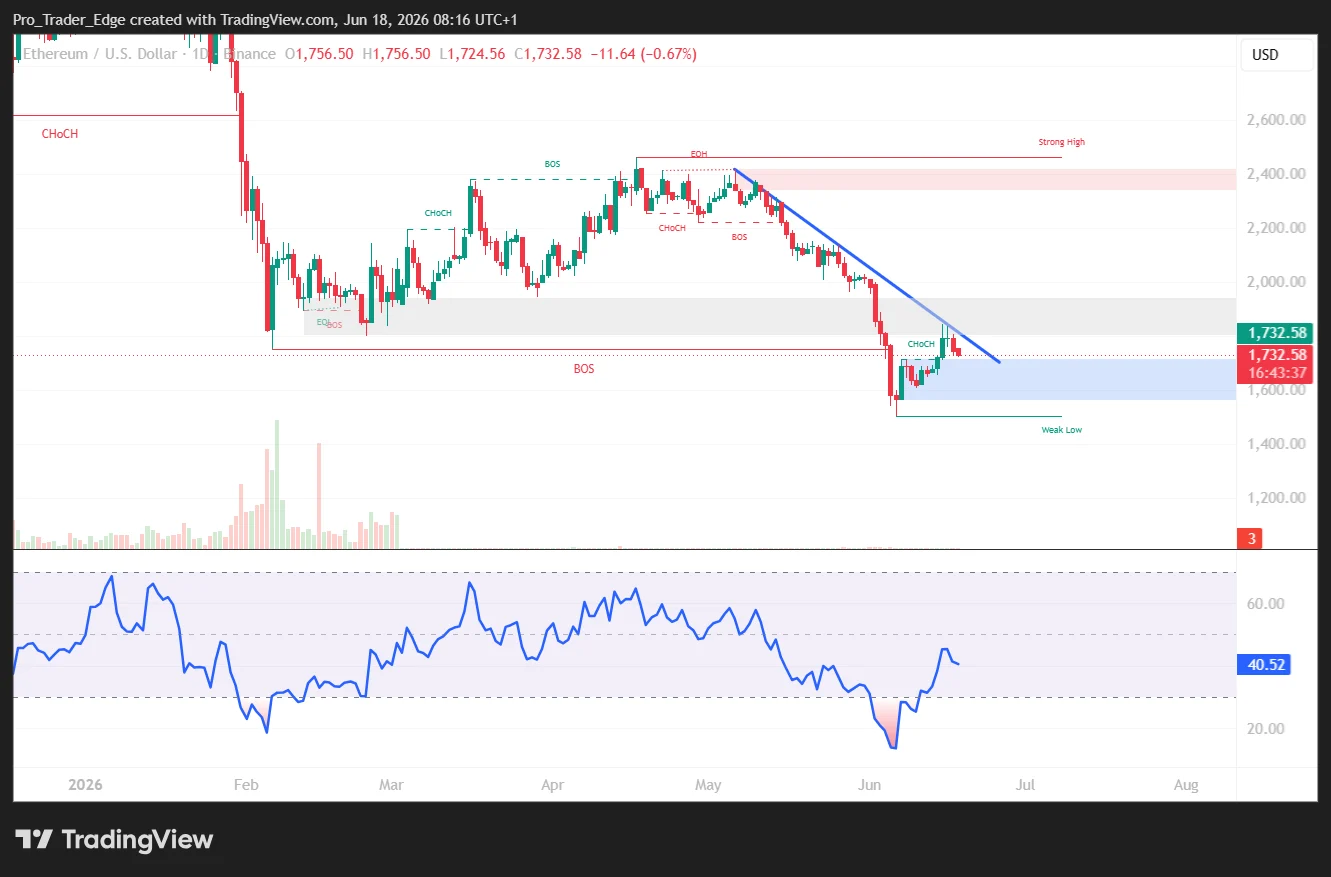 Source: TradingView
Technical analysis of the daily timeframe shows ETH trading below its 20-day, 50-day, and 100-day exponential moving averages. These technical indicators are positioned in a cluster ranging from approximately $1,794 through $2,109.
The closest overhead barrier sits at the 20-day EMA around $1,794. Beyond that, market participants are monitoring the horizontal resistance level positioned at $1,806.
Should ETH manage to push through current resistance, subsequent upside targets include $1,909, $1,955, and $2,019. The 100-day EMA positioned near $2,108 represents an additional obstacle that may cap rallies.
Critical Support Zone Takes Center Stage
Looking at potential downside scenarios, the most immediate support level is located near $1,741. Should that level fail, subsequent support zones are found at $1,524, $1,405, and ultimately $1,156.
Additional analysis has emphasized the importance of the $1,700-$1,750 area. A decisive breakdown below $1,700 could potentially accelerate selling pressure and open the door to a retest of levels below $1,500.
Commentary from market analyst Ted Pillows highlighted that Ethereum has broken beneath $1,800, and emphasized that the $1,700-$1,750 support zone must maintain integrity for bulls to mount another recovery attempt, warning that failure could lead ETH toward the sub-$1,500 region.
Market observers also note that upcoming Federal Reserve policy guidance combined with subdued trading volumes could influence ETH price behavior heading into the end of June. The current technical picture remains straightforward: Ethereum continues to trade within a compressed range, with overhead resistance clustered near $1,794-$1,806 and downside support concentrated at $1,741 and the broader $1,700-$1,750 zone.
The post Ethereum (ETH) Faces Critical Test at $1,700 Support Zone Amid Weakening Derivatives appeared first on Blockonomi.


You May Also Like

Moody’s Assigns First-Ever Rating to Bitcoin-Backed Municipal Bond in Historic Crypto Finance Move

MultiChoice loses 57,000 DStv and Gotv subscribers in Kenya between January and March 2026
Futures Rise, Oil Drops As Market Prices In Iran Deal For Yet Another Day


