

Solana (SOL) Eyes Bull Run Revival as Classic Pattern Re-Emerges at $71
Key Highlights
- Solana rebounds to approximately $71 following strong support at the $60 price level
- Trader Matthew Dixon warns that the upcoming FOMC decision could create volatility near the $70 zone
- Derivative open interest climbed marginally to $4.72B, though volume declined 25.83% to $4.17B
- Technical analyst BATMAN identifies a weekly MACD bullish divergence similar to patterns preceding SOL’s prior major rally
Solana has staged a notable comeback from its $60 support zone, with the asset currently hovering near the $71 mark. This positions the cryptocurrency at a pivotal juncture that could determine its short-term trajectory.
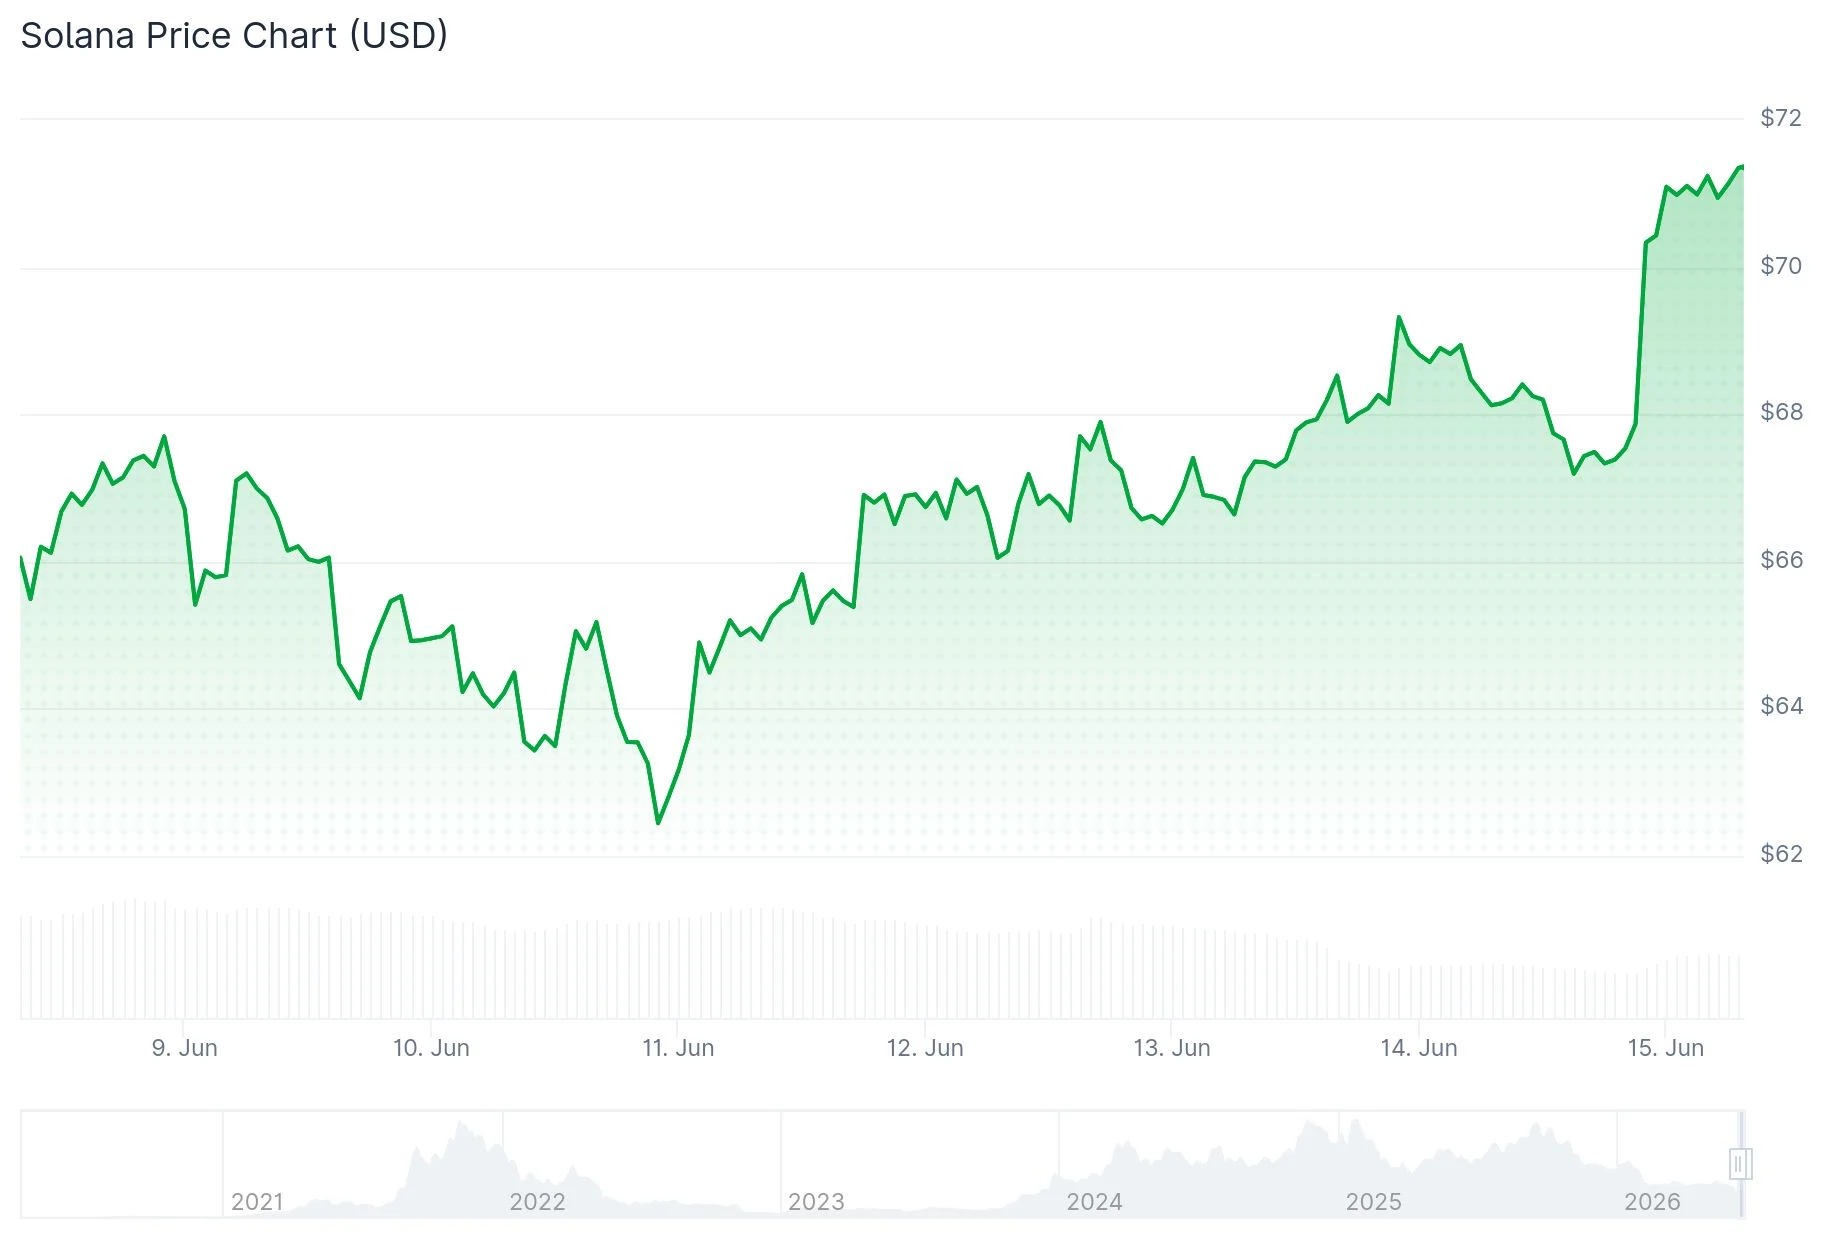 Solana (SOL) Price
Trader Daan Crypto Trades has pinpointed $67 as the February bottom—a critical threshold that Solana must recapture and maintain to confirm a bullish reversal. Should SOL fail to hold this level, a retest of the $60 support zone becomes increasingly likely.
Assuming Solana successfully defends the $67 floor, analysts are targeting $79 and $95 as the next significant resistance zones on the weekly timeframe.
Trader Matthew Dixon is closely monitoring the $68–$70 range on shorter time intervals. His analysis suggests that SOL has climbed from oversold RSI territory and is now navigating through key Fibonacci retracement levels following its bounce from $60.
Dixon has also highlighted the Federal Reserve’s upcoming FOMC meeting as a critical event that could influence market direction. Should the Fed adopt a more hawkish stance, risk assets including cryptocurrencies may face downward pressure, potentially limiting SOL’s advance near the $70 threshold.
Crypto technical analyst BATMAN has drawn attention to a significant development on Solana’s weekly MACD indicator. According to BATMAN’s assessment, SOL is exhibiting a bullish divergence pattern emerging from a structural wedge breakout—the same technical formation that appeared before its previous significant bull cycle.
Futures Market Signals Mixed Sentiment
Derivatives data reveals that open interest in SOL futures contracts increased by 0.29%, reaching $4.72 billion. Conversely, trading volume experienced a sharp 25.83% decline to $4.17 billion, indicating that while positions remain open, active trading participation has diminished.
The current funding rate stands at -0.0023%, reflecting a mildly bearish bias among futures traders. Market participants appear to be maintaining their positions while adopting a wait-and-see approach.
On June 14, analyst BitGuru observed that Solana appears to be finding equilibrium around a significant support level, with accumulation beginning to emerge.
BitGuru has identified the $80–$82 range as the next key resistance area, which would come into play should bullish momentum persist.
Current Market Status
As of the time of writing, Solana was changing hands at $71 with 24-hour trading volume reaching $2.76 billion and a total market capitalization of $39.27 billion. The token had declined 1.26% in the preceding 24-hour period.
Matthew Dixon’s longer-term perspective anticipates a potential market bottom forming around October, correlating with Bitcoin’s four-year halving cycle dynamics. He characterizes the present upward movement as a temporary relief bounce unless Solana can establish sustained trading above the $70 level.
The post Solana (SOL) Eyes Bull Run Revival as Classic Pattern Re-Emerges at $71 appeared first on Blockonomi.


You May Also Like

Tokenized RWA Markets Remained Resilient During US-Iran Conflict – Bitget-Block Scholes Report

Iran’s foreign minister targeted in assassination attempt, wife killed

Zimbabwe Crypto Regulation S.I. 99 of 2026 Takes Effect Now


