-
Solana has lost a crucial support zone near $76-$78, while declining open interest and weakening volume suggest bears remain in control despite the latest bounce.
-
Although technicals display a bullish divergence, SOL could face another wave of selling if it fails to reclaim the broken support range.
Solana price has finally broken out of its prolonged consolidation phase, but not in the direction bulls had hoped. After spending nearly four months trading within a well-defined range, SOL slipped below the lower boundary, triggering a sharp decline toward the $72 region. Although the token has managed a modest rebound, the breakdown has raised concerns that the recent consolidation may have served as a distribution phase rather than a base for a bullish continuation.
Besides, the momentum indicators are weakening, on-chain participation is cooling, and derivatives data are pointing to a drop in market conviction. With this, Solana now faces a crucial test, and the coming sessions could determine whether it can reclaim its lost support range or not.
Solana Price Analysis: Breakdown Below Key Support Shifts Momentum to the Bears
The daily chart suggests Solana’s recent weakness is more than just a routine pullback. After repeatedly defending the $76-$78 support zone since February, SOL has finally broken below the range. The level had acted as a critical demand area for months, making the latest breakdown a significant technical development for traders.
While the price has bounced from recent lows near $72, SOL continues to trade beneath the former support range. Unless bulls quickly reclaim this area, the latest rebound could be viewed as a relief rally rather than the start of a sustainable recovery.
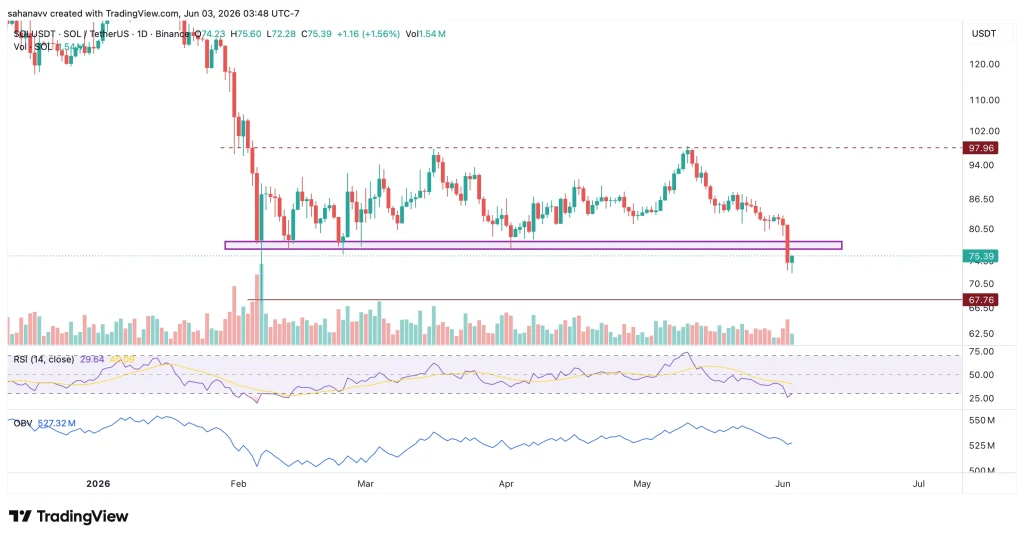
The daily RSI has slipped below the oversold threshold, reflecting intense selling pressure across the market. Although such conditions can trigger short-term rebounds, they rarely signal a trend reversal on their own. The On-Balance Volume (OBV) indicator continues to trend lower, suggesting capital outflows remain dominant and buyers have yet to regain control of the trend. However, both have displayed a bullish divergence, which keeps the bullish hopes alive.
Derivatives Data Signals Weakening Bullish Conviction
Data shows the funding rate has recently turned negative, indicating that short sellers are increasingly willing to pay a premium to maintain bearish positions. While negative funding can occasionally precede a short squeeze, the current reading primarily reflects growing downside expectations among leveraged traders. Open interest data adds another layer of concern. After peaking above $4 billion in May, open interest has fallen sharply to nearly $3.2 billion.
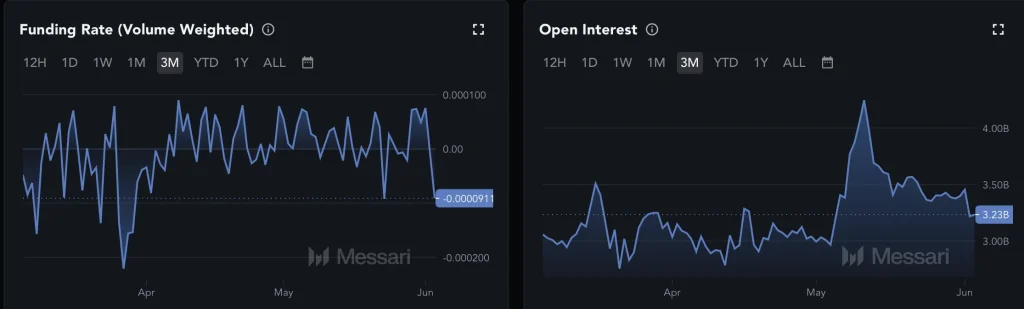
The combination of falling open interest and negative funding rates points to weakening market conviction. This trend is further supported by declining on-balance volume, which indicates that buying pressure remains subdued despite the latest rebound. Unless Solana sees a meaningful recovery in trader participation and capital inflows, the current bounce may struggle to evolve into a sustained uptrend.
Can Solana Avoid Another 20% Decline?
Solana now finds itself at a critical technical crossroads. A successful recovery above $78 could invalidate the recent breakdown and improve the chances of a broader rebound. However, the risk remains tilted to the downside as long as SOL trades below the broken support. The next major demand zone sits near $67, a level that could provide temporary relief if selling pressure persists.
A decisive breakdown below this support would expose the token to the low-$60 region, representing a potential decline of nearly 20% from current levels. With momentum indicators, volume trends, and derivatives data all favoring caution, traders may continue to watch the $76-$78 range as the key level that could determine Solana’s next major move.