

Nike Stock Faces Heavy Selling, Bears Take Control After Rally Fails Above $46

Nike stock faces renewed bearish pressure after a brief rally lifted NKE above $46. The sharp reversal on June 2 closed the shares at $43.73, reflecting underlying structural challenges.
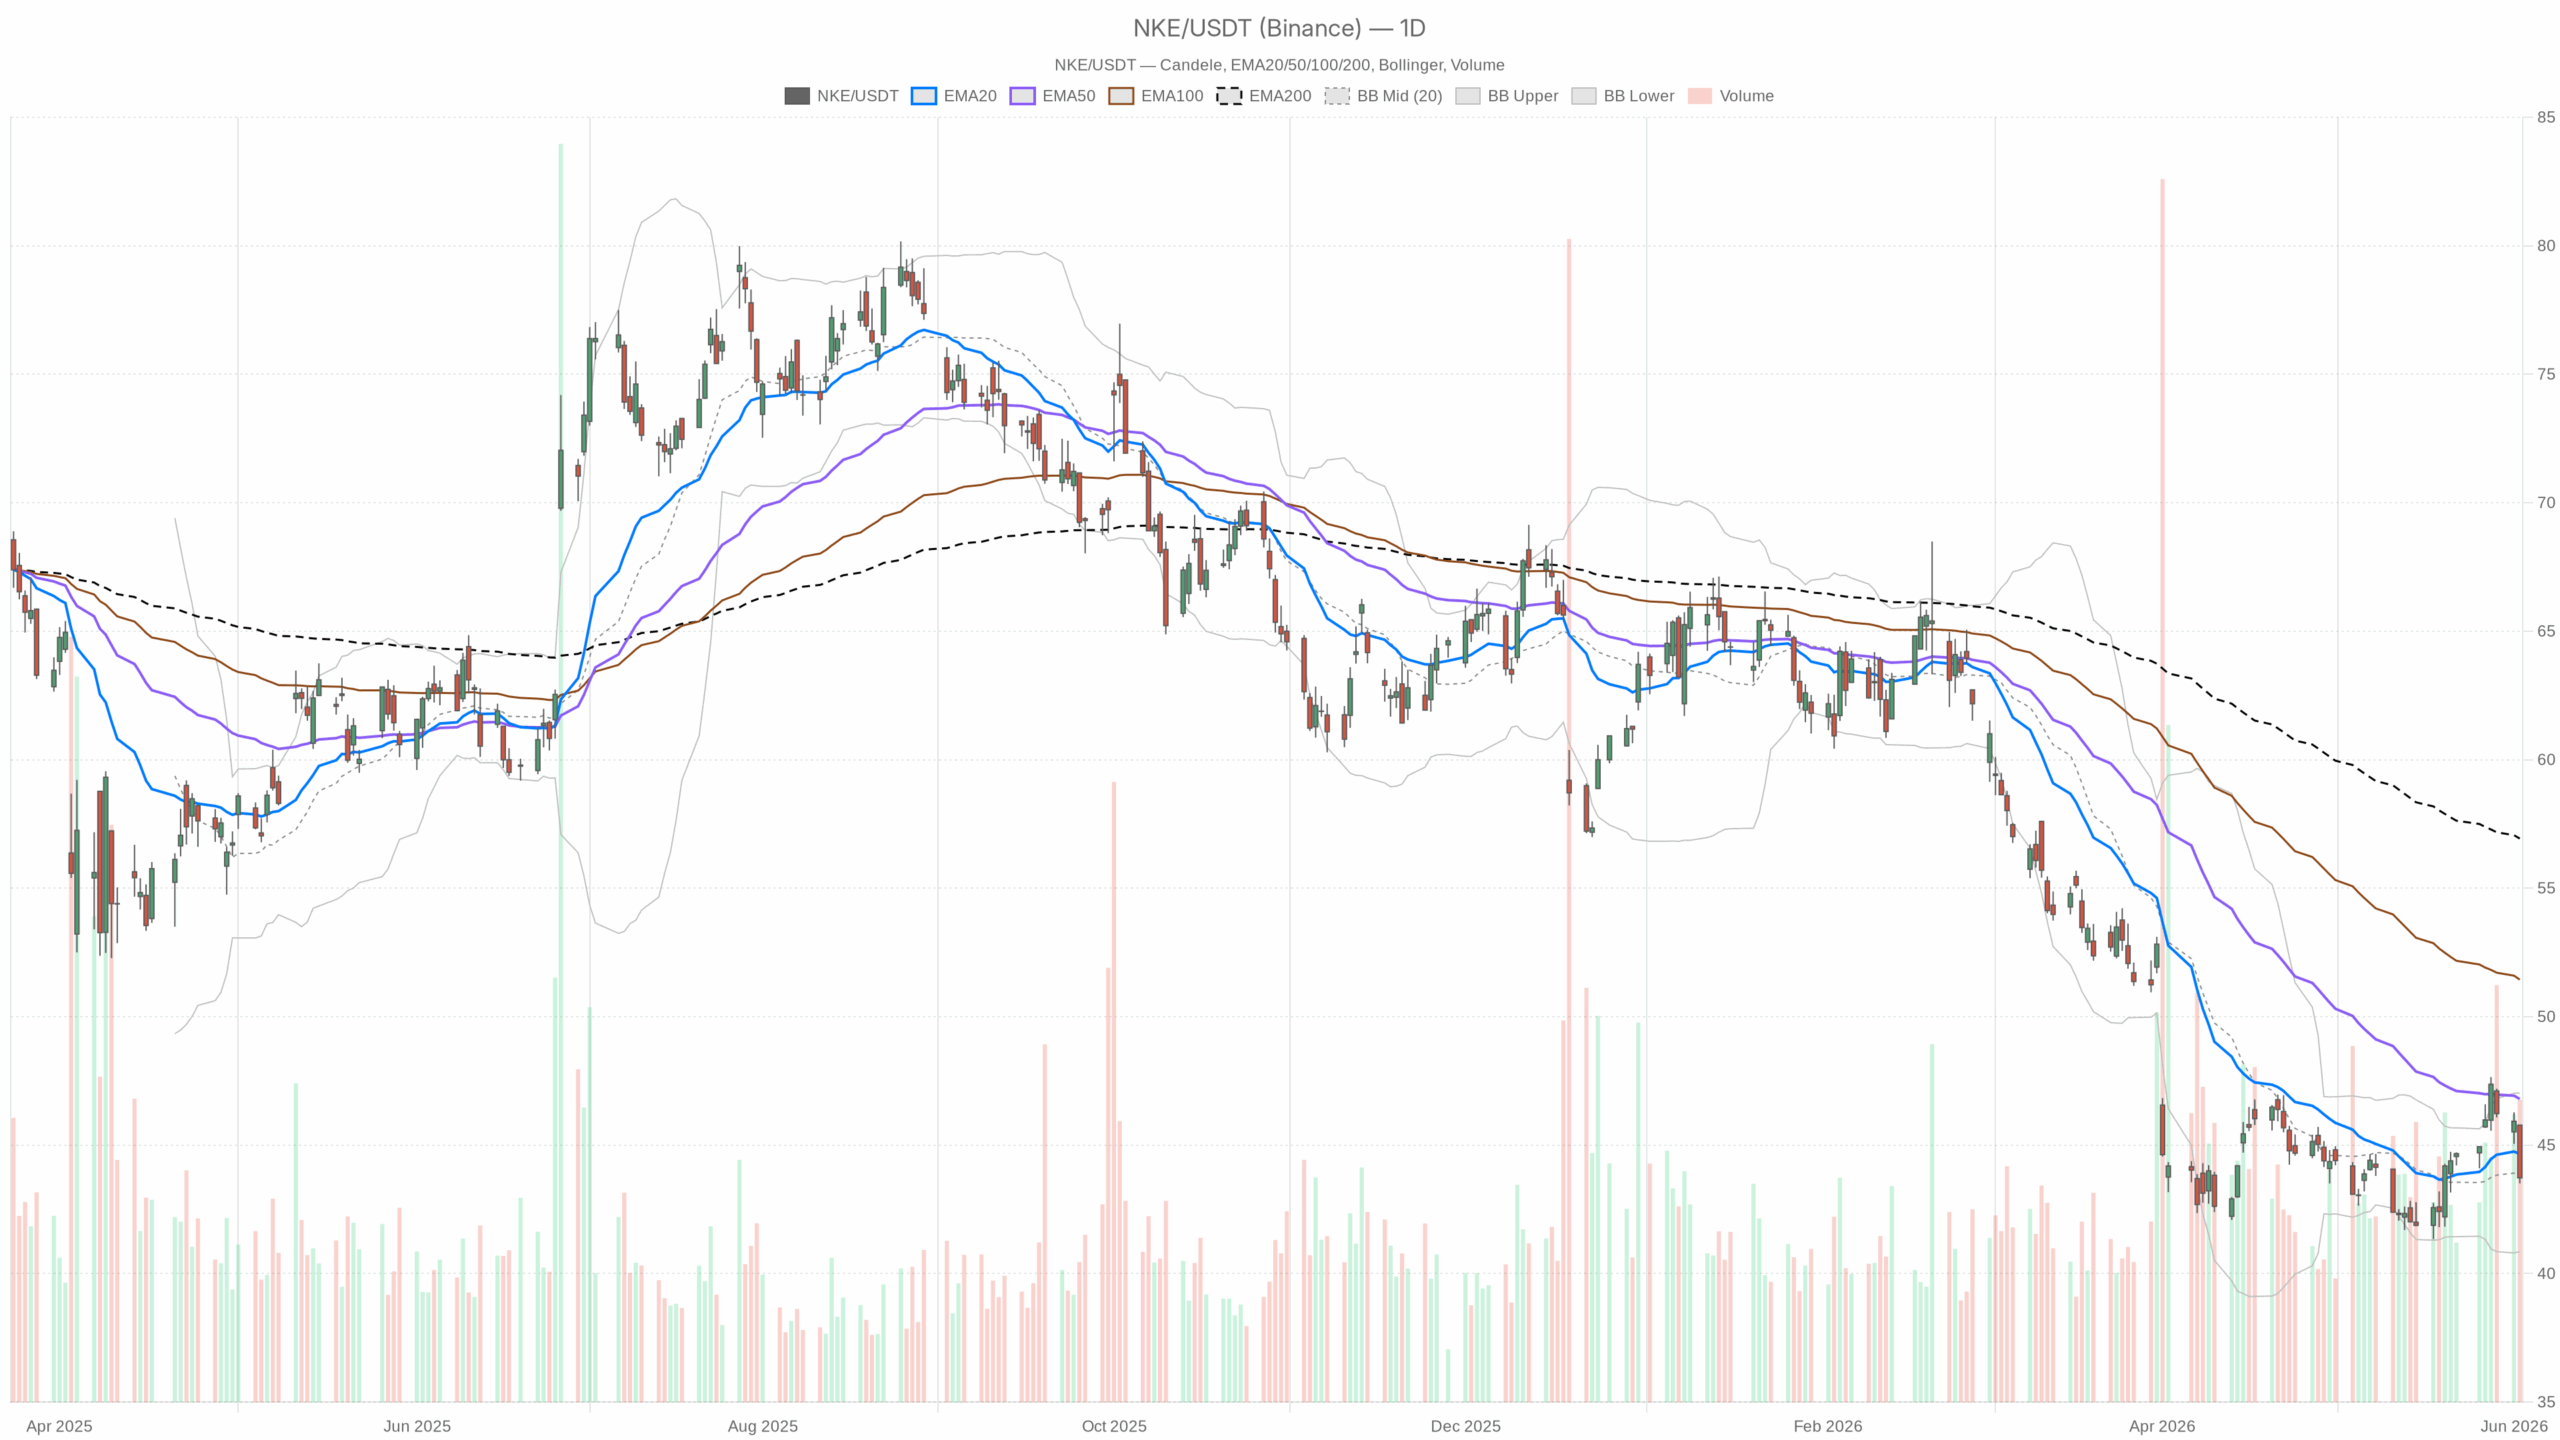 NKE — daily chart with candlesticks, EMA20/EMA50 and volume.
Nike Stock Technical Overview: Bearish Daily Regime
The daily chart presents a clear bearish picture. NKE closed below its EMA20 at $44.65 and EMA50 at $46.80, while the EMA200 remains significantly overhead at $56.93. This descending order of moving averages forms a textbook bear setup. On June 2, the stock opened at $45.78 but closed lower at $43.73, signaling heavy selling pressure rather than distribution.
Momentum Indicators Confirm Downward Bias
The daily RSI at 44.21 remains in bearish territory without hitting oversold levels, suggesting further downside is possible. While the MACD histogram at +0.40 might appear bullish, both its line and signal remain negative, indicating only a slowdown in bearish momentum rather than a reversal. This nuance warns bears to remain cautious, but bulls have no clear signal yet.
Volatility and Support/Resistance Context
Bollinger Bands place the midline at $43.94, near the closing price, indicating no clear support or oversold condition. The lower band at $40.86 serves as a plausible downside target. With a daily ATR of $1.40, price swings remain wide, underscoring significant volatility. Immediate resistance now lies at the daily pivot $44.34, followed by R1 at $45.17, while support holds near $42.90.
Hourly Chart Confirms Bearish Momentum in Nike Stock
At the hourly level, the trend appears neutral, reflecting short-term exhaustion from the aggressive selloff. The H1 RSI at 29.38 nears oversold, a potential signal but one that contrasts with the dominant daily downtrend. Typically, oversold readings in a downtrend act as traps rather than turnarounds.
Moving Averages and MACD on Hourly Chart
The hourly EMA20 at $44.95 and EMA50 at $45.12 both exceed the EMA200 at $44.44, yet price trades below all three. This compression confirms a broken intraday trend. The hourly MACD, with a line at -0.63 and signal at -0.34, generates a negative histogram at -0.28, showing no recovery momentum, reinforcing the daily bearish bias.
Short-Term Perspective: 15-Minute Chart Signals Pause, Not Recovery
The 15-minute MACD histogram has turned slightly positive at +0.07, hinting at minor intraday stabilization after the sharp drop. RSI at 35.31 has bounced from lows but remains weak. Price persists below all major EMAs, keeping the regime bearish. This pause should be viewed as a technical breather rather than a genuine recovery, with short-term bounces likely serving as selling opportunities.
Fundamental Context and Market Sentiment Around Nike Stock
Nike’s technical struggles are reinforced by a cautious fundamental backdrop. The stock has underperformed the Nasdaq Composite over the past year. Doubts have emerged on whether recent optimism was justified. While Nike’s “Win Now” strategy and disciplined inventory may have long-term potential, current earnings trajectories have failed to sway investors.
Potential Scenarios for Nike Stock
Bullish Scenario
A credible reversal requires reclaiming the $44.34 pivot zone and holding above the daily EMA20 near $44.65. A genuine daily MACD line crossover above zero supported by improving hourly momentum could propel NKE toward $45.17 and beyond. Positive developments on tariff exposure or guidance upgrades would bolster this scenario.
Bearish Scenario
More structurally supported at present, a failure to regain $44.34 would maintain resistance pressure. A break below daily support at $42.90 would accelerate selling and target the Bollinger lower band at $40.86. The prevailing EMA configuration, negative MACD, and non-oversold RSI suggest meaningful downside remains.
Conclusion: Nike Stock Faces Technical Pressure with Downside Bias
In summary, Nike stock encounters significant technical headwinds. The daily trend is clearly bearish, while hourly signals indicate oversold conditions without recovery confirmation. The 15-minute chart shows short-term stabilization but lacks conviction. Elevated volatility and structural weaknesses advise caution. Until the daily chart exhibits genuine repair beyond a one-day rebound, the path of least resistance for NKE points lower.


You May Also Like

Meet Kobushi, The Tiny Pygmy Hippo Who Just Made The Entire Internet Cry Happy Tears

Pre-Market Update: S&P 500 Seeks Longest Winning Streak Since 1995 as Oil Prices Rise

New fund set up to build $500m mixed-use project in Riyadh


