

Bitcoin price risks slide to $60K as Iran retaliates against U.S. strikes
Bitcoin price is testing the key $65,000 support zone after Iran’s retaliatory strikes against the U.S. spooked investors, with charts suggesting a deeper slide toward $60,000 if bears remain in control.
- Bitcoin price fell 4.5% to an intraday low of $65,700 as Iran’s retaliatory strikes against the U.S. intensified risk-off sentiment across crypto markets.
- U.S. spot Bitcoin ETFs recorded $519 million in outflows, extending the streak to 12 straight trading days.
- Bitcoin is nearing completion of a bearish rounding top pattern, with analysts warning that a break below $65,000 could expose the $60,000 demand zone.
According to data from crypto.news, Bitcoin (BTC) fell 4.5% to an intraday low of $65,700 on Wednesday, June 3, before recovering to trade near $67,100 at press time. The decline extended losses that began after BTC previously broke below the key $72,000 and $68,000 support levels, bringing the cryptocurrency close to its lowest price since February.
Bitcoin price faced pressure on Wednesday after reports said Iran launched missiles at the U.S. Fifth Fleet headquarters in Bahrain following U.S. strikes. The escalation added fresh risk-off pressure across crypto markets as investors moved toward defensive assets, including gold and silver.
U.S. spot Bitcoin ETFs added to the selling pressure after recording $519 million in net outflows on Tuesday, per data from SoSoValue. The withdrawal extended the outflow streak to 12 straight trading days, the longest such run since the fund’s launch, showing that institutional demand has weakened during the latest downturn.
Strategy’s disclosure also remained a concern for traders. The company said in a Form 8-K filing that it sold 32 BTC for roughly $2.5 million, its first Bitcoin sale in nearly four years. While the sale was small, it challenged the firm’s long-running buy-and-hold narrative and weighed on market confidence.
Bitcoin selloff has intensified as macro stress returns
Oil markets remained volatile as traders assessed the risk of further disruption in the Middle East. Crude prices had jumped earlier after tensions around Iran and the U.S. worsened, raising concerns that energy inflation could return as a policy problem for the Federal Reserve.
Gold and silver prices fell alongside cryptocurrencies, suggesting investors were cutting risk across markets rather than seeking refuge in precious metals. At the same time, Japan’s Nikkei 225 rose 2.5% on Wednesday, highlighting a divergence between crypto assets and parts of the equity market.
Derivatives markets added to the decline, with more than 272,300 traders liquidated over the past 24 hours. Total crypto liquidations reached $1.8 billion, most of which came from long positions as Bitcoin lost key support levels per data from CoinGlass.
Mt. Gox-linked wallets also revived supply concerns after moving 10,422 BTC, worth roughly $739 million, to a new address. No direct sale was confirmed, but the transfer renewed fears that creditor repayments could bring additional spot supply into a weak market.
Bitcoin breakdown puts $65K and $60K support in focus
On the daily chart, Bitcoin price is close to completing a rounding top pattern after failing to sustain its recovery from the February low. In technical analysis, a rounding top is a bearish reversal formation that often develops near market peaks and can lead to a deeper correction once support at the base of the pattern breaks.
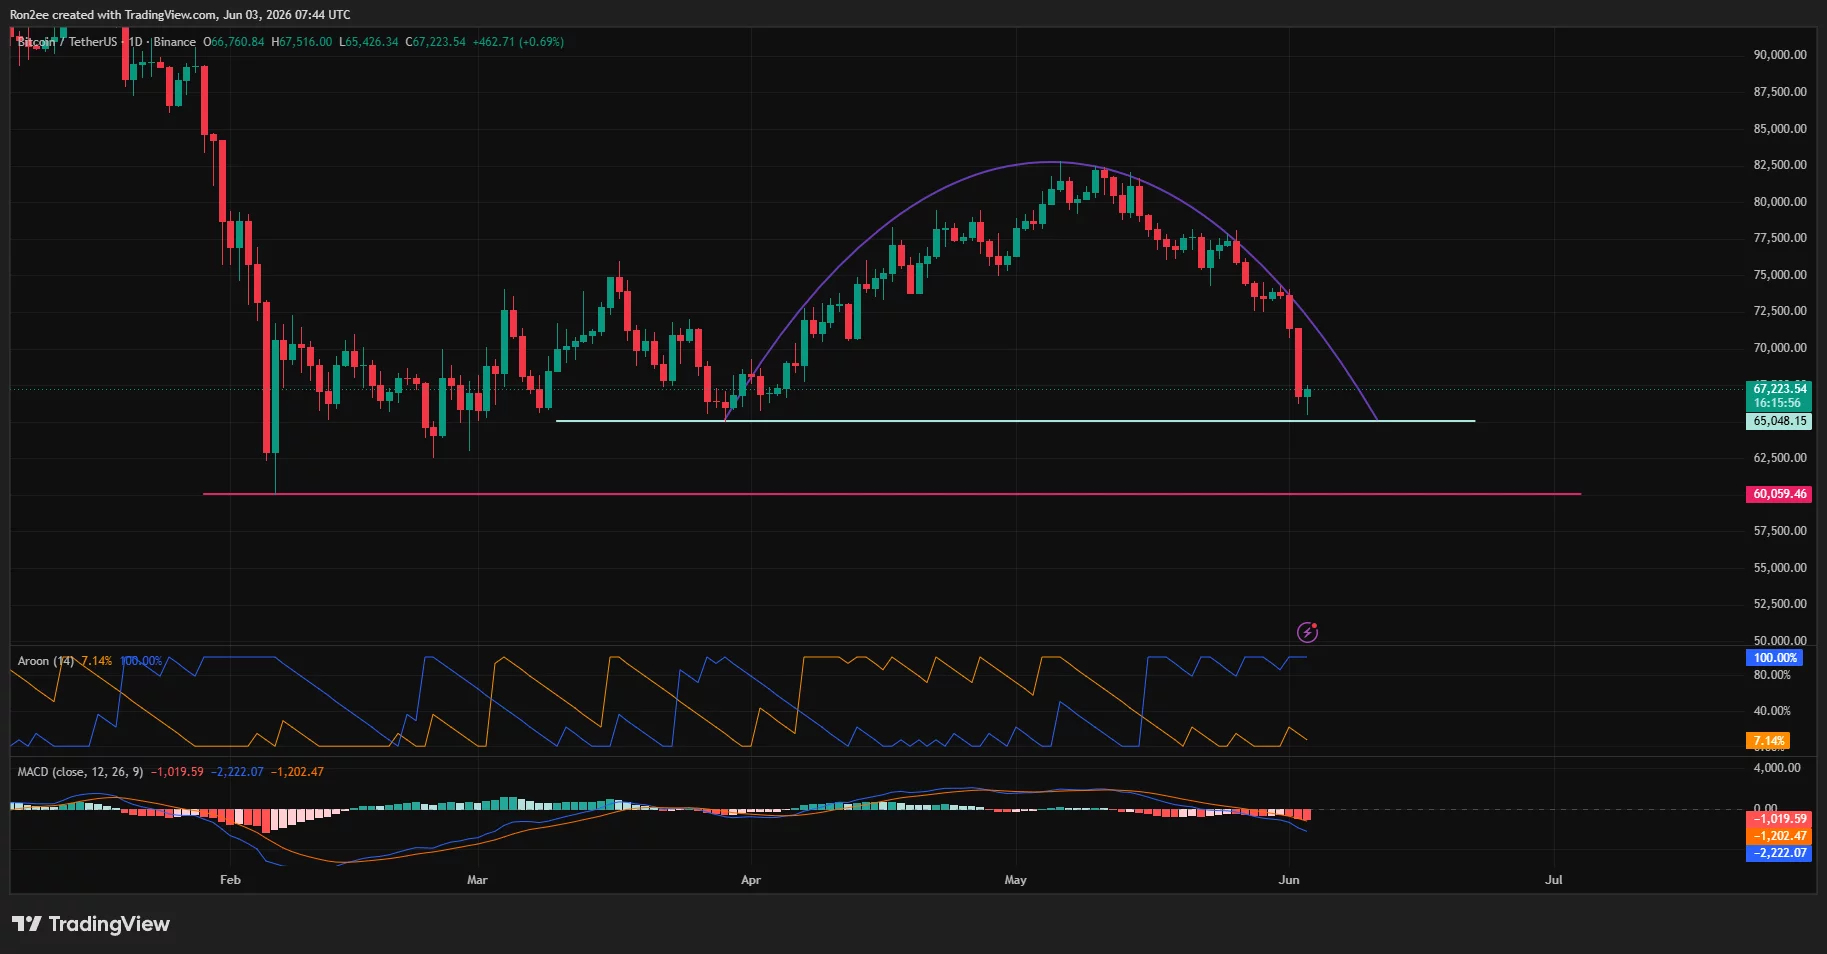
The weekly chart shows BTC trading below the 0.786 Fibonacci retracement level near $74,233. The next major level sits near the full retracement zone around $60,042, while the $65,400 area now acts as the first downside checkpoint.
The Supertrend indicator on the weekly chart has flipped bearish, with resistance near $90,050. Bitcoin also remains far below the 0.618 Fibonacci level near $85,374 and the midpoint retracement near $93,199, leaving the recovery path difficult unless buyers reclaim higher levels quickly.
Momentum indicators seem to favor the sellers. On the daily chart, the Aroon down line is at 100%, while the Aroon up line is near 7.14%, showing that sellers still control the short-term trend. The MACD line has also dropped deeper below the signal line, with the histogram below zero.
According to crypto analyst Master of Crypto, Bitcoin has “already lost the $72K and $68K support levels.”
Team LAMBO shared a similar view after Bitcoin nearly hit its $65,000 target. Commenting on the setup, the analyst noted that BTC “might go retest the 0.618 fib and then see a rejection from 68.7k towards 65k or even lower to sweep liquidity.”
A clean break below $65,000 would expose the $60,000 demand zone next. However, a recovery above $68,700 could delay the downside move and open a retest of $72,000. A stronger close above $74,233 would weaken the bearish setup and bring the lost Fibonacci support back into play.
Disclosure: This article does not represent investment advice. The content and materials featured on this page are for educational purposes only.


You May Also Like

Meet Kobushi, The Tiny Pygmy Hippo Who Just Made The Entire Internet Cry Happy Tears

Pre-Market Update: S&P 500 Seeks Longest Winning Streak Since 1995 as Oil Prices Rise

New fund set up to build $500m mixed-use project in Riyadh


