

Ethereum Price Gets Crushed To $1,840 Amid Relentless Selling Pressure
Ethereum price started a fresh decline and traded below $1,950. ETH is now consolidating below $1,920 and might continue to move down.
- Ethereum remained in a bearish zone after a fresh decline below $1,950.
- The price is trading below $1,950 and the 100-hourly Simple Moving Average.
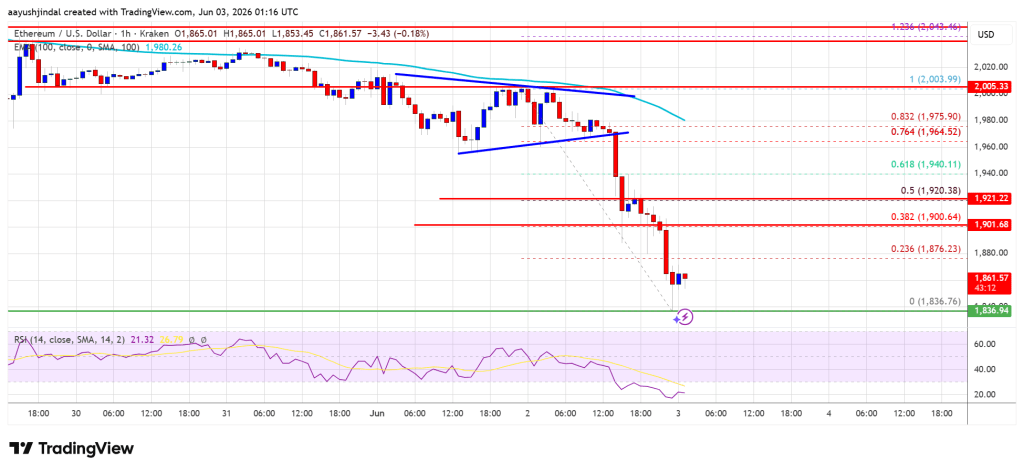
- There was a break below a contracting triangle with support at $1,975 on the hourly chart of ETH/USD (data feed via Kraken).
- The pair could continue to move down if it stays below the $2,000 zone.
Ethereum Price Extends Decline
Ethereum price failed to remain stable above $2,000 and started a fresh decline, like Bitcoin. ETH price dipped below the $1,980 and $1,950 levels.
There was a break below a contracting triangle with support at $1,975 on the hourly chart of ETH/USD. The price even traded below $1,920. A low was formed at $1,836, and the price is now consolidating losses well below the 23.6% Fib retracement level of the downward move from the $2,003 swing high to the $1,836 low.
Ethereum price is now trading below $1,950 and the 100-hourly Simple Moving Average. If the bulls remain in action above $1,840, the price could attempt another increase. Immediate resistance is seen near the $1,880 level.
The first key resistance is near the $1,900 level. The next major resistance is near the $1,920 level and the 50% Fib retracement level of the downward move from the $2,003 swing high to the $1,836 low. A clear move above the $1,920 resistance might send the price toward the $1,950 resistance. An upside break above the $1,950 region might call for more gains in the coming days. In the stated case, Ether could rise toward the $2,000 resistance zone or even $2,020 in the near term.
More Downside In ETH?
If Ethereum fails to clear the $1,950 resistance, it could start a fresh decline. Initial support on the downside is near the $1,840 level. The first major support sits near the $1,820 zone.
A clear move below the $1,820 support might push the price toward the $1,780 support. Any more losses might send the price toward the $1,740 region. The main support could be $1,720.
Technical Indicators
Hourly MACD – The MACD for ETH/USD is gaining momentum in the bearish zone.
Hourly RSI – The RSI for ETH/USD is now below the 50 zone.
Major Support Level – $1,840
Major Resistance Level – $1,950


You May Also Like

Cryptopolitan Launches Crypto Data Dashboards and Becomes the First Media Platform with Full Agentic AI Access

Japanese Yen Slips as Stronger US PMI Data Reinforces Hawkish Fed Stance

Will Pi Network price fall to a new all-time low as a falling wedge breaks down?


