

Solana (SOL) Prints Never-Before-Seen Chart Signal: Similar Pattern Preceded a Massive Rally
Solana (SOL) has entered a phase that few investors have ever seen before. After months of relentless weakness, a rare pattern has appeared on the monthly chart. History suggests that such conditions have only emerged near major market bottoms, which is why many analysts are now paying close attention to Solana price action.
The timing is particularly interesting because SOL price has already fallen sharply from its 2025 high. Market participants are now trying to determine whether Solana is close to a major reversal or whether another leg lower remains ahead before a meaningful recovery can begin.
Solana Prints a Monthly Pattern Never Seen Before in Its History
Crypto analyst Crypto Patel recently pointed out a remarkable development on the Solana chart.
Patel noted that SOL has now printed 8 consecutive red monthly candles. This is the first time such a pattern has appeared in Solana’s entire history.
A look back at the previous major bear market provides some useful context. Following Solana’s all time high near $260 in November 2021, the asset entered a brutal decline that eventually pushed the price down to around $8.
That cycle produced 9 red monthly candles in total. Those red candles were not consecutive. The final red candle eventually marked the exact bottom before Solana began one of the strongest recoveries in the crypto market.
From that $8 low, Solana price climbed to a new all time high near $295 over the following two years.
Patel believes the current structure shares some similarities with that previous cycle. SOL has already dropped from a high of $253 to a low of $67. The ninth monthly candle is currently forming, which means the market could be approaching another major turning point.
Historical comparisons never guarantee identical outcomes. Even so, the appearance of such a rare monthly pattern naturally attracts attention because previous extreme weakness eventually created a strong accumulation zone.
Patel believes the key accumulation area remains between $80 and $50 if Solana extends its decline. His long-term fractal projection suggests a return toward the $500 to $1,000 region could become possible over the next one to two years if history repeats itself.
Solana Price Breakdown Shows Sellers Still Control the Market
Despite the encouraging long term pattern, short-term Solana price action remains weak.
A look at the SOL chart shows that price recently broke below a pattern that had been holding for nearly three months. The breakdown became obvious yesterday and the move has increased downside pressure across the market.
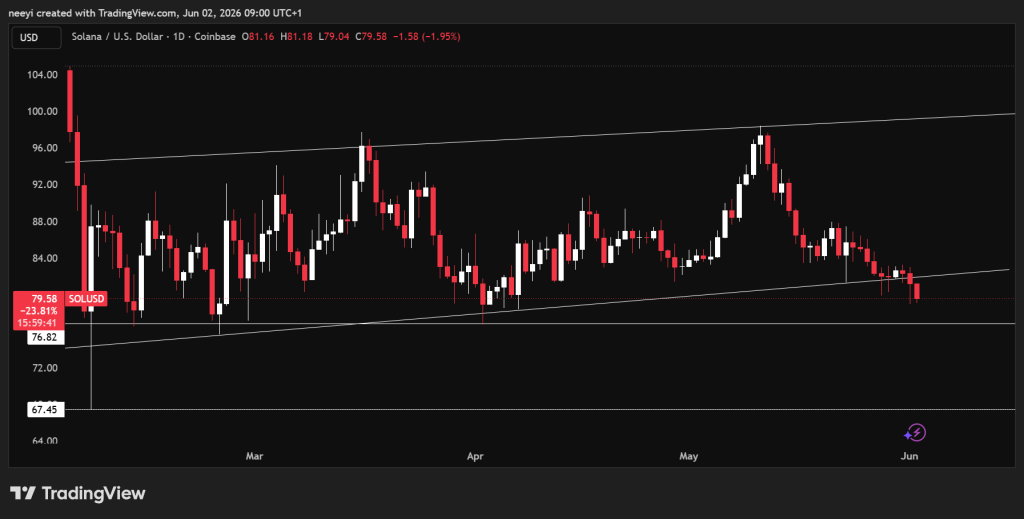 SOL Price Chart Showing Ascending Channel and Key Levels
Current price action shows that SOL has already lost an important support area. Trading near $79 leaves the asset vulnerable to another decline toward $76.
That level deserves close attention because it could determine the next major move. Failure to hold above $76 may open the door for another decline toward the previous low near $67. Buyers will need to defend these support zones aggressively if a meaningful recovery is going to emerge.
Market structure currently favors caution because the breakdown has not yet produced evidence that a durable bottom has formed.
Related Article: DeepSeek AI Predicts Solana Price for June – Will SOL Survive the Sell‑Off?
Weekly Indicators Continue to Point Toward Weakness
Weekly technical indicators remain mostly bearish, which supports the possibility of one more downward move before a full reversal develops.
The Relative Strength Index currently stands at 34.712. That reading shows SOL is approaching oversold territory but has not reached an extreme level that often accompanies major market bottoms.
The Stochastic indicator sits at 38.357. This reading shows momentum remains weak and buyers have not regained control of the trend.
MACD currently reads negative 15.155. A negative MACD value generally indicates bearish momentum remains dominant across higher timeframes.
ADX comes in at 22.362. This suggests the existing trend still has enough strength to continue, although it is not exceptionally powerful.
The Ultimate Oscillator stands at 42.284. That reading points to continued weakness and shows buying pressure remains limited.
| Indicator | Metrics | Interpretation of Reading |
|---|---|---|
| RSI (14) | 34.712 | Near oversold conditions but sellers still maintain control |
| STOCH (9,6) | 38.357 | Weak momentum and limited bullish strength |
| MACD (12,26) | -15.155 | Bearish momentum remains dominant |
| ADX (14) | 22.362 | Downtrend still active with moderate strength |
| Ultimate Oscillator | 42.284 | Buying pressure remains relatively weak |
The bigger picture presents an interesting contradiction.
The rare monthly pattern identified by Crypto Patel suggests SOL could be moving closer to the type of environment that historically preceded a major recovery. Previous market cycles show that extreme pessimism often appears near important bottoms.
Recent support levels have already failed, weekly indicators remain bearish, and price still has room to fall toward $76 or even $67 before finding stronger demand.
Read Also: This $1.25B Ripple Play Changes XRP Forever – Corporate Treasury Takeover Begins
That combination means Solana price could be getting closer to the much anticipated reversal. Current evidence also suggests the market may need one final downward move before a lasting bottom finally forms.
FAQs
Subscribe to our YouTube channel for daily crypto updates, market insights, and expert analysis.
The post Solana (SOL) Prints Never-Before-Seen Chart Signal: Similar Pattern Preceded a Massive Rally appeared first on CaptainAltcoin.


You May Also Like

Bitcoin breaks critical support as dollar and oil move together, raising risk of a deeper drop

Improving Macro Backdrop Set to Keep Dollar Resilient, BCA Says

Iran Signals Preferential Passage for Japanese Ships Through Hormuz


