

Robinhood Stock Stalls Near $76.6 as Bears Keep Control

Robinhood Stock (HOOD) is attempting a rebound as it retests resistance near 76.6, but the daily trend remains defensive. Price reclaimed the mid-range while staying below key gauges, making this a tactical bounce within a broader corrective phase.
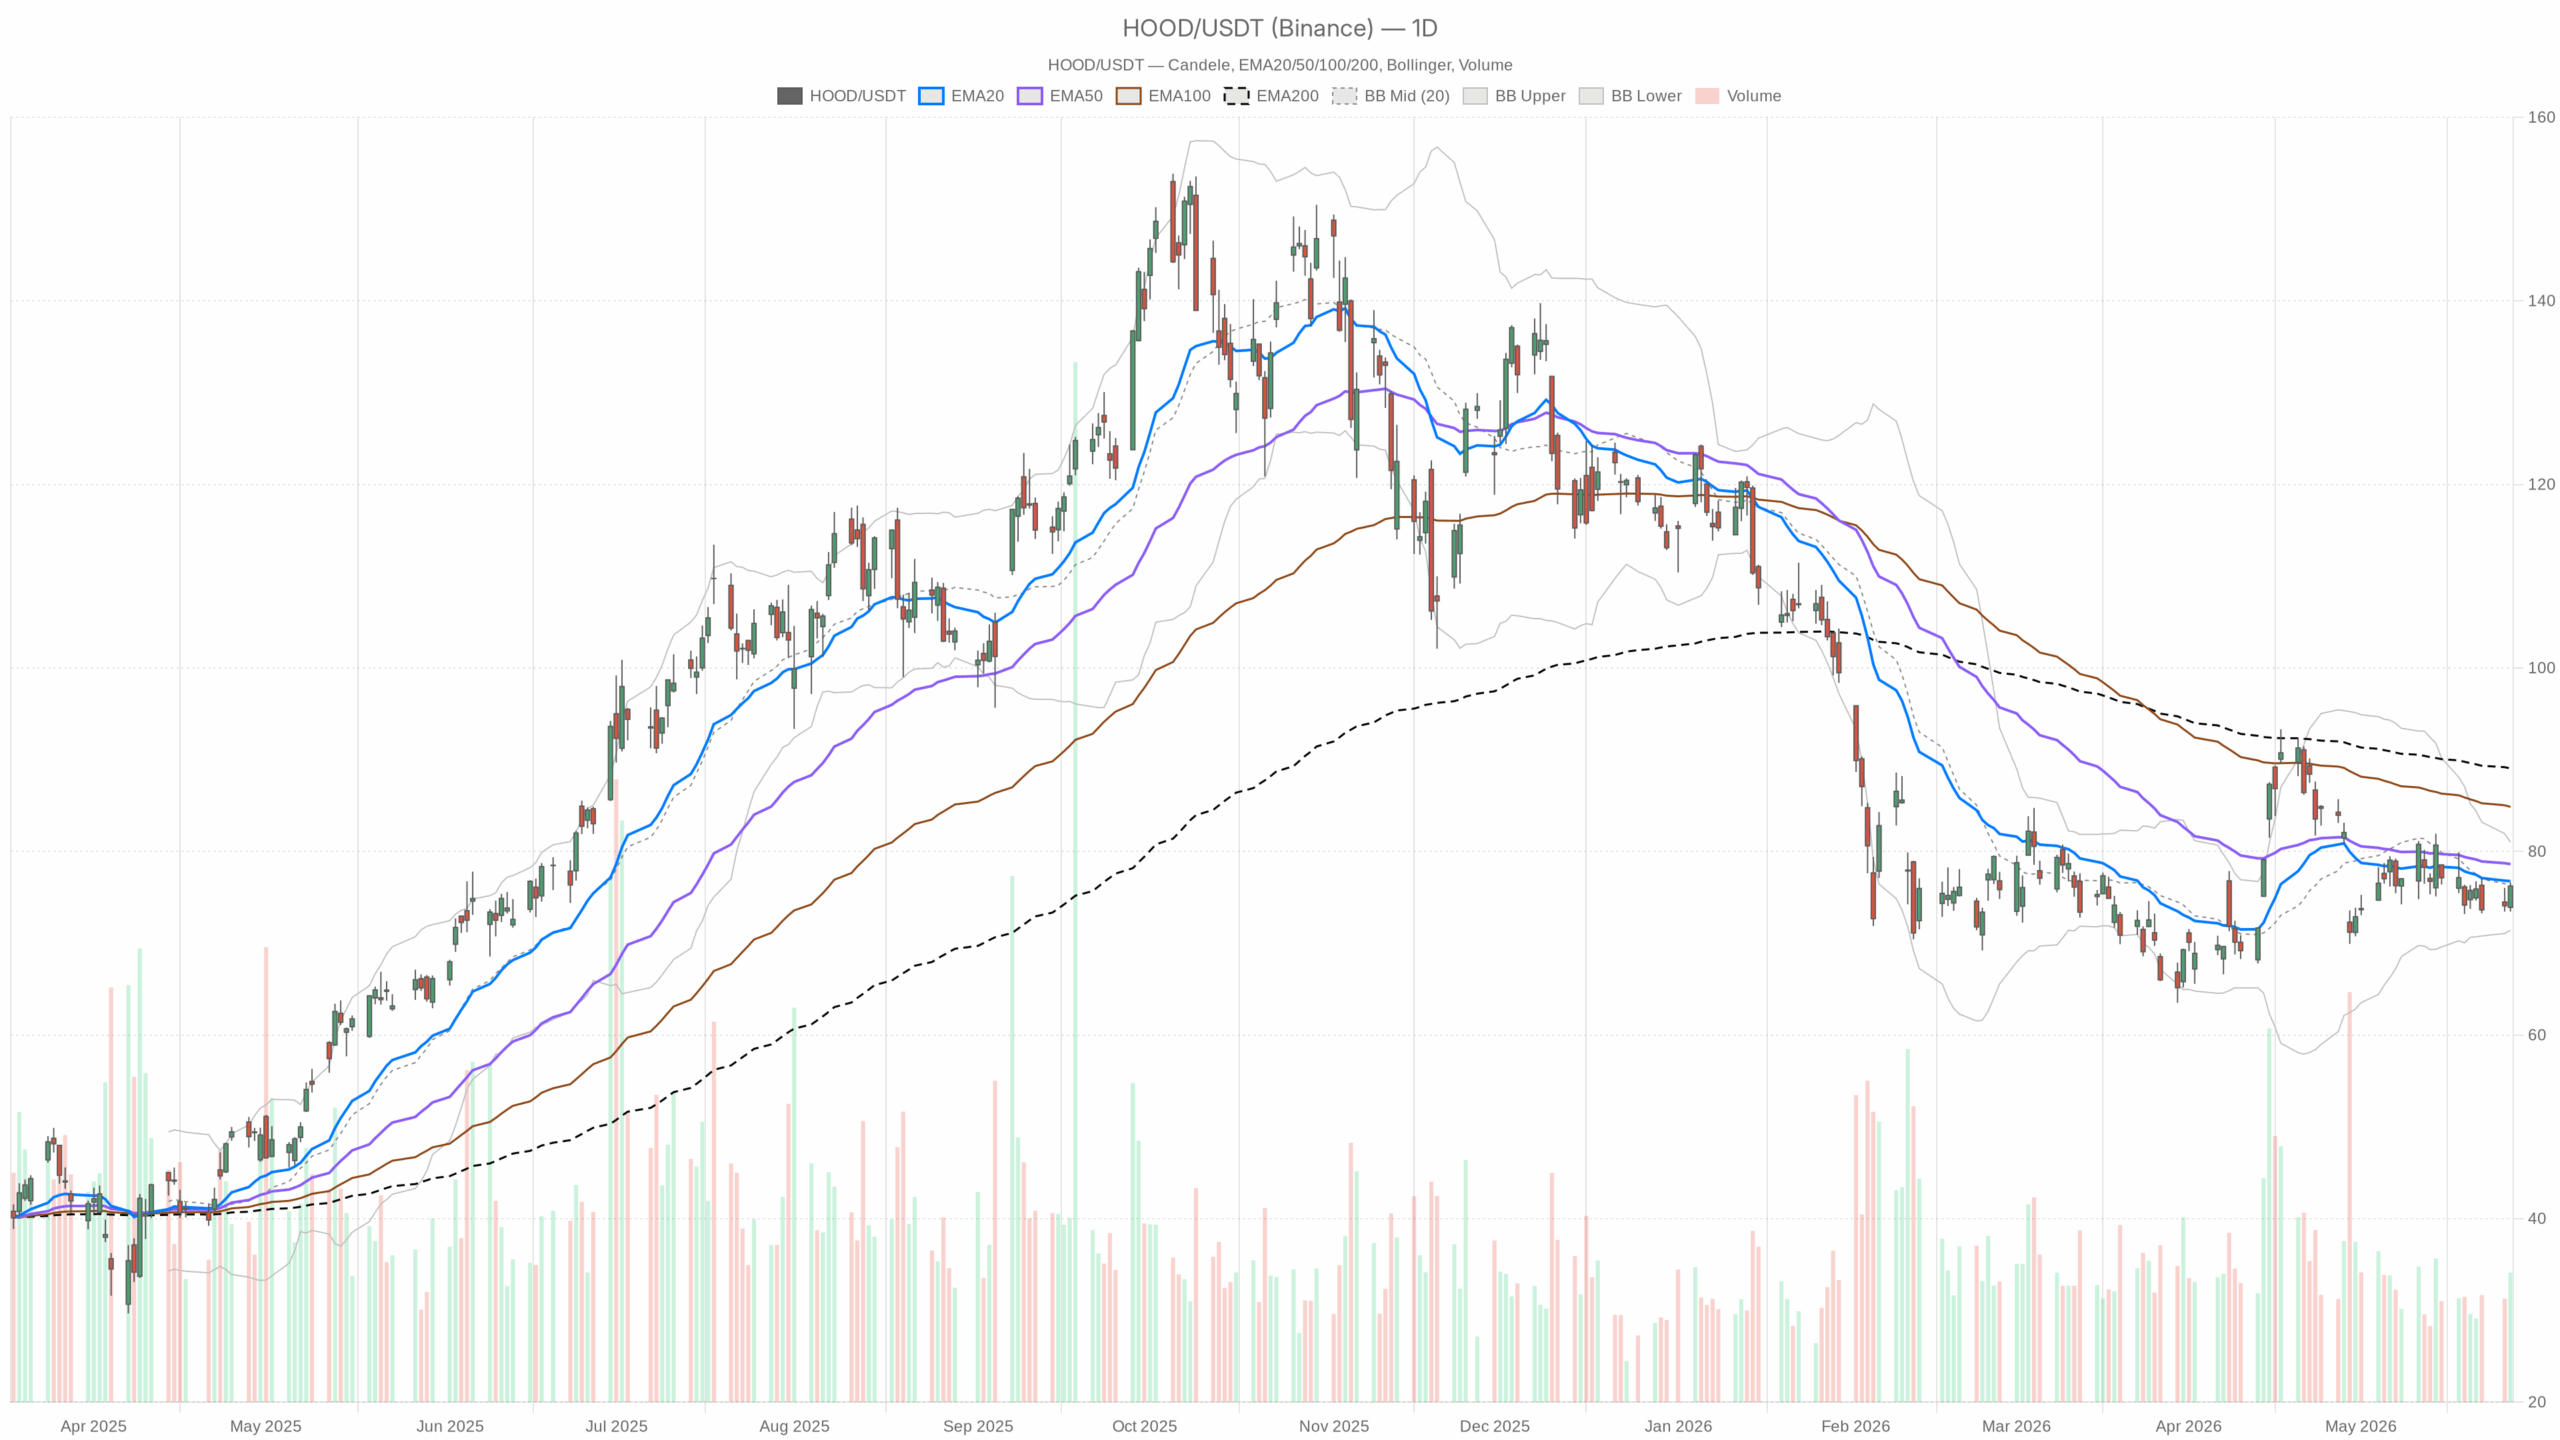 HOOD — daily chart with candlesticks, EMA20/EMA50 and volume.
Daily technical overview for Robinhood Stock
On the daily timeframe, HOOD closed at 76.23, almost exactly on the Bollinger mid-band at 76.21. This placement signals balance after a pullback. (Price at the mid-band often reflects a range equilibrium.) However, the bounce is running into nearby resistance at 76.5–76.7.
Daily EMAs sit above price: EMA20 76.76, EMA50 78.63, and EMA200 89.06. This keeps the primary trend down. (Being below all three averages shows the longer trend remains unresolved on the downside.)
Notably, daily RSI14 is 48.54. Momentum is neutral to soft, not yet in bullish control. The daily MACD line is -0.86 versus a -0.52 signal, with a -0.34 histogram. Downside momentum has not flipped positive. (MACD remains below its signal, so the turn higher is incomplete.)
Daily ATR14 is 3.86. Volatility is elevated and single-day swings remain wide. The daily pivot is 75.44 with R1 at 77.43 and S1 at 74.24. Trading above the pivot tilts near-term risk slightly higher, but R1 looms as the first upside test. The model’s regime tag is “bearish.” The daily bias therefore stays cautious.
Intraday setup (1H) for HOOD
Meanwhile, the 1H chart shows constructive improvement. Price at 76.22 sits above the 1H EMA20 (75.22) and EMA50 (75.52) but still below the 1H EMA200 (76.63). Short-term tone improved, yet the 200-hour remains a cap. (This frames 76.6–76.7 as first resistance.)
At the same time, 1H RSI14 is 58.21. Intraday buyers are in control, but not stretched. The 1H MACD shows a 0.19 line above a -0.09 signal with a 0.28 histogram. Momentum is building on the upside. 1H Bollinger bands place price near the upper band at 76.54, indicating the rally is pressing into resistance. 1H ATR14 is 1.10, implying manageable but active ranges. The 1H pivot is 76.32 with R1 at 76.54 and S1 at 76.00. Price just below the pivot reflects hesitation into resistance.
15-minute micro trend and execution levels
Additionally, the 15-minute view offers execution context. Price at 76.22 holds above the 15m EMA20 (75.74), EMA50 (75.23), and EMA200 (75.64). The micro-trend is up.
Still, the 15m RSI14 at 62.65 shows positive momentum that is nearing a near-term stretch. The 15m MACD has a small positive histogram (0.03). Upside impulse is slowing into resistance. The 15m Bollinger upper band sits at 76.64, so room is limited before supply. The 15m pivot is 76.23 with R1 at 76.36 and S1 at 76.09. These levels help time breakouts or pullbacks around the 76.3 area.
News and sentiment around Robinhood Stock
Therefore, the tape improvement likely reflects a sentiment boost from product headlines and coverage. Robinhood’s test of AI agents for trading and purchases has grabbed attention. This can support engagement hopes, but it also raises trust questions. (Headline support, execution risk.)
Goldman’s reiterated Buy rating adds a positive lean. (Analyst support can aid dips, but it does not change the chart alone.) Separately, reports of 27.6 million funded accounts speak to scale. (This is a structural tailwind, not a near-term technical catalyst.)
Trading scenarios and key levels for HOOD
Bullish path to confirm rebound
For bulls, the path is clear but narrow. A push and 1H close above 76.54–76.63, followed by a daily close above 76.76 (daily EMA20), would strengthen the rebound. That would open 77.43 (daily R1) and then 78.63 (daily EMA50). Daily RSI back above 50 and a MACD curl higher would confirm momentum repair. On the 15m, holding 76.09 and clearing 76.36 would aid timing.
Bearish reversal triggers
On the other hand, rejection beneath 76.5–76.7 combined with a slip below 75.44 (daily pivot) would hand control back to sellers. That would expose 74.24 (daily S1) and the recent swing low near 73.45. A daily close back under the Bollinger mid-band would reassert the downtrend, with the lower band at 71.42 as the broader-range risk marker. A roll in 1H RSI back below 50 and a MACD cross down would validate the fade.
Bottom line: bias, volatility, and positioning
Overall, the daily bias for Robinhood Stock (HOOD) is neutral-to-bearish with a constructive intraday bounce. The battleground sits at 76.5–76.7. Expect active trading given ATR readings, and size positions to the volatility backdrop. Until the daily trend reclaims the 20-day EMA, rallies deserve respect but also skepticism.


You May Also Like

Oura Ring 5 Debuts with Sleeker Design and Advanced Sleep Blood Pressure Monitoring

Japanese Yen Slips to Four-Week Low as Hormuz Tensions Outweigh Intervention Fears

SoFiUSD Launch Signals Major Shift in US Banking Payments



