

Can Tron price rally past $0.40 as it approaches bullish channel breakout?
Tron has surged to a 1.5-year high near $0.38 as rising stablecoin activity and bullish derivatives positioning fuel breakout bets above $0.40.
- Tron price climbed to a 1.5-year high near $0.38 as traders positioned for a potential breakout above the psychological $0.40 level.
- TRX futures open interest surged to multi-month highs while CoinGlass liquidation data showed dense short liquidity clustered between $0.38 and $0.40.
- Tron’s stablecoin dominance continued expanding in 2026, with USDT supply on the network surpassing $85 billion during the first quarter.
According to data from crypto.news, Tron (TRX) price was trading around $0.376 at press time, up roughly 40% from its February lows and more than 60% above its January bottom.
The token has outperformed several major layer-1 networks over the past three months as Bitcoin remained trapped below key resistance and capital rotated into high-cash-flow blockchain ecosystems tied to stablecoin infrastructure.
According to market data, the total value of USDT circulating on Tron surpassed $85 billion during the first quarter of 2026, lifting the network’s share of the global stablecoin market above 27.3%. Tron now hosts nearly half of all Tether supply in circulation, reinforcing its role as the dominant settlement layer for low-fee cross-border transfers and emerging-market payments.
Meanwhile, on-chain usage continued accelerating through May. Binance Square data showed Tron processed a record 978.3 million transactions during Q1, while average daily throughput climbed to 126 transactions per second. Daily fee generation also increased as USDT transfer activity expanded across Asia and Latin America, where Tron remains the preferred network for dollar-denominated remittances.
The supply side has tightened alongside the transaction surge. Because TRX is consumed as network gas for millions of stablecoin transfers each day, the protocol has maintained a deflationary structure for much of the year. More tokens have been removed from circulation through burns than distributed to validators in block rewards, creating persistent downward pressure on liquid exchange supply.
Corporate treasury demand added another tailwind during the latest rally phase. On May 25, Tron Inc. disclosed adding nearly 137,000 TRX in a single day, bringing its treasury holdings above 697 million TRX.
The continued treasury expansion has reduced available spot liquidity during breakout attempts, particularly as leveraged traders increased bullish positioning across derivatives exchanges.
The narrative around Tron’s AI initiatives has also gained traction since March. TRON DAO unveiled a $1 billion AI-focused ecosystem fund earlier this year to expand autonomous payment systems, machine-to-machine finance infrastructure, and agentic treasury management tools.
Projects tied to automated payments and AI-driven settlement systems have since emerged as one of the fastest-growing categories inside the Tron ecosystem.
Derivatives positioning and liquidation clusters support breakout momentum
Open interest across TRX futures markets climbed to multi-month highs as momentum traders chased the rally into the final week of May. CoinGlass data showed aggregate futures open interest previously crossed $381 million earlier this month before extending higher during the latest price push toward $0.38.
Funding rates remained firmly positive across Binance, Bybit, and OKX perpetual markets, showing traders continued paying a premium to maintain long exposure rather than positioning for a correction.
Elevated positive funding often increases liquidation risk during overheated rallies, though it also confirms aggressive directional demand while momentum remains intact.
CoinGlass liquidation heatmaps show a dense cluster of leveraged short liquidations sitting between $0.38 and $0.39. Another major liquidity pocket appears just above the $0.40 threshold. If TRX clears the upper resistance zone, forced short covering could accelerate upside volatility over a short period.
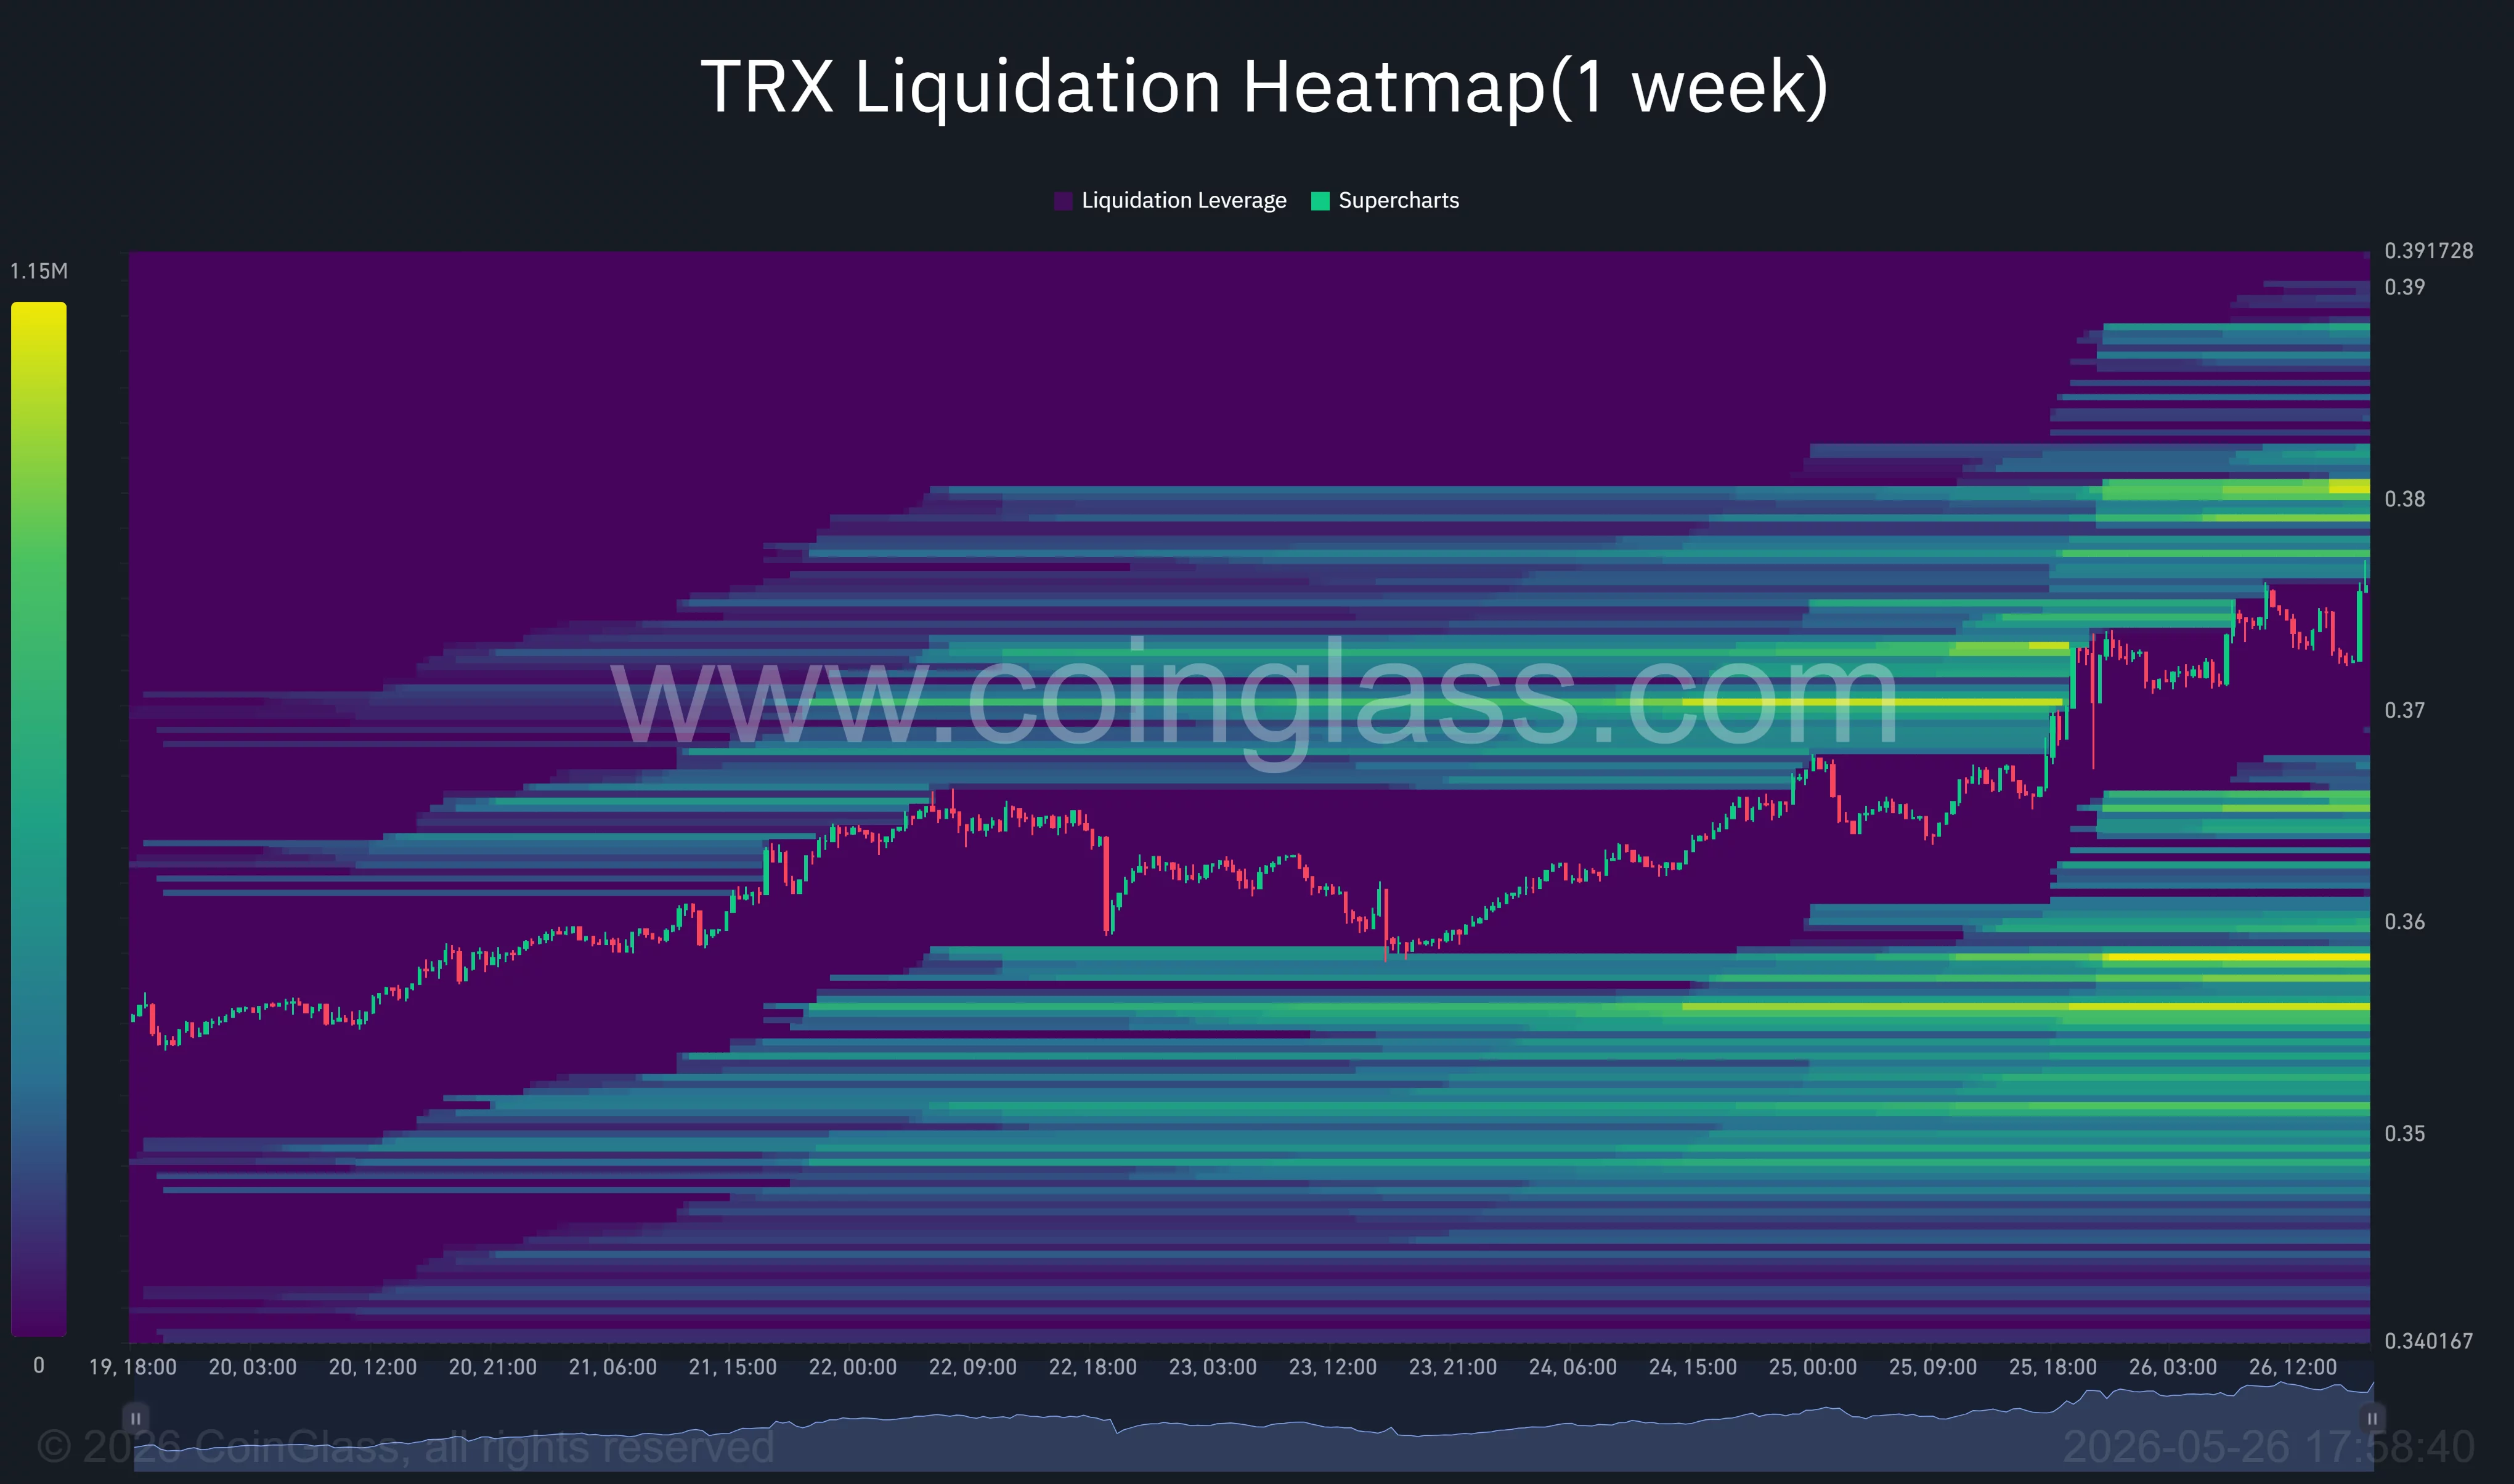
At the same time, downside liquidity remains concentrated near the $0.355 and $0.35 levels, where leveraged long positions have accumulated during the latest channel advance.
A sharp rejection below those zones could trigger a temporary flush before buyers attempt another recovery.
Crypto trading group Alpha Crypto Signal described the current structure as a “clean weekly reversal in motion” after TRX reclaimed its neckline breakout level and held above key moving averages.
Macro conditions have also improved for speculative crypto assets over the past two weeks. Treasury yields eased slightly after softer U.S. labor-market data revived expectations that the Federal Reserve could still deliver rate cuts later this year.
A weaker dollar environment has historically supported risk assets, particularly high-beta cryptocurrencies with strong momentum and active derivatives participation.
Unlike several altcoins that remain heavily dependent on ETF narratives or venture-backed ecosystem incentives, Tron’s current rally has largely been driven by direct network usage and cash-flow generation.
Stablecoin settlement fees continue feeding the burn mechanism while rising transaction demand keeps activity elevated even during slower periods across decentralized finance markets.
Technical indicators show TRX testing upper channel resistance
The daily chart shows TRX trading inside a rising channel that has remained intact since late February. Price recently rebounded from the channel midpoint near $0.35 before pushing toward the upper trendline resistance around $0.387.
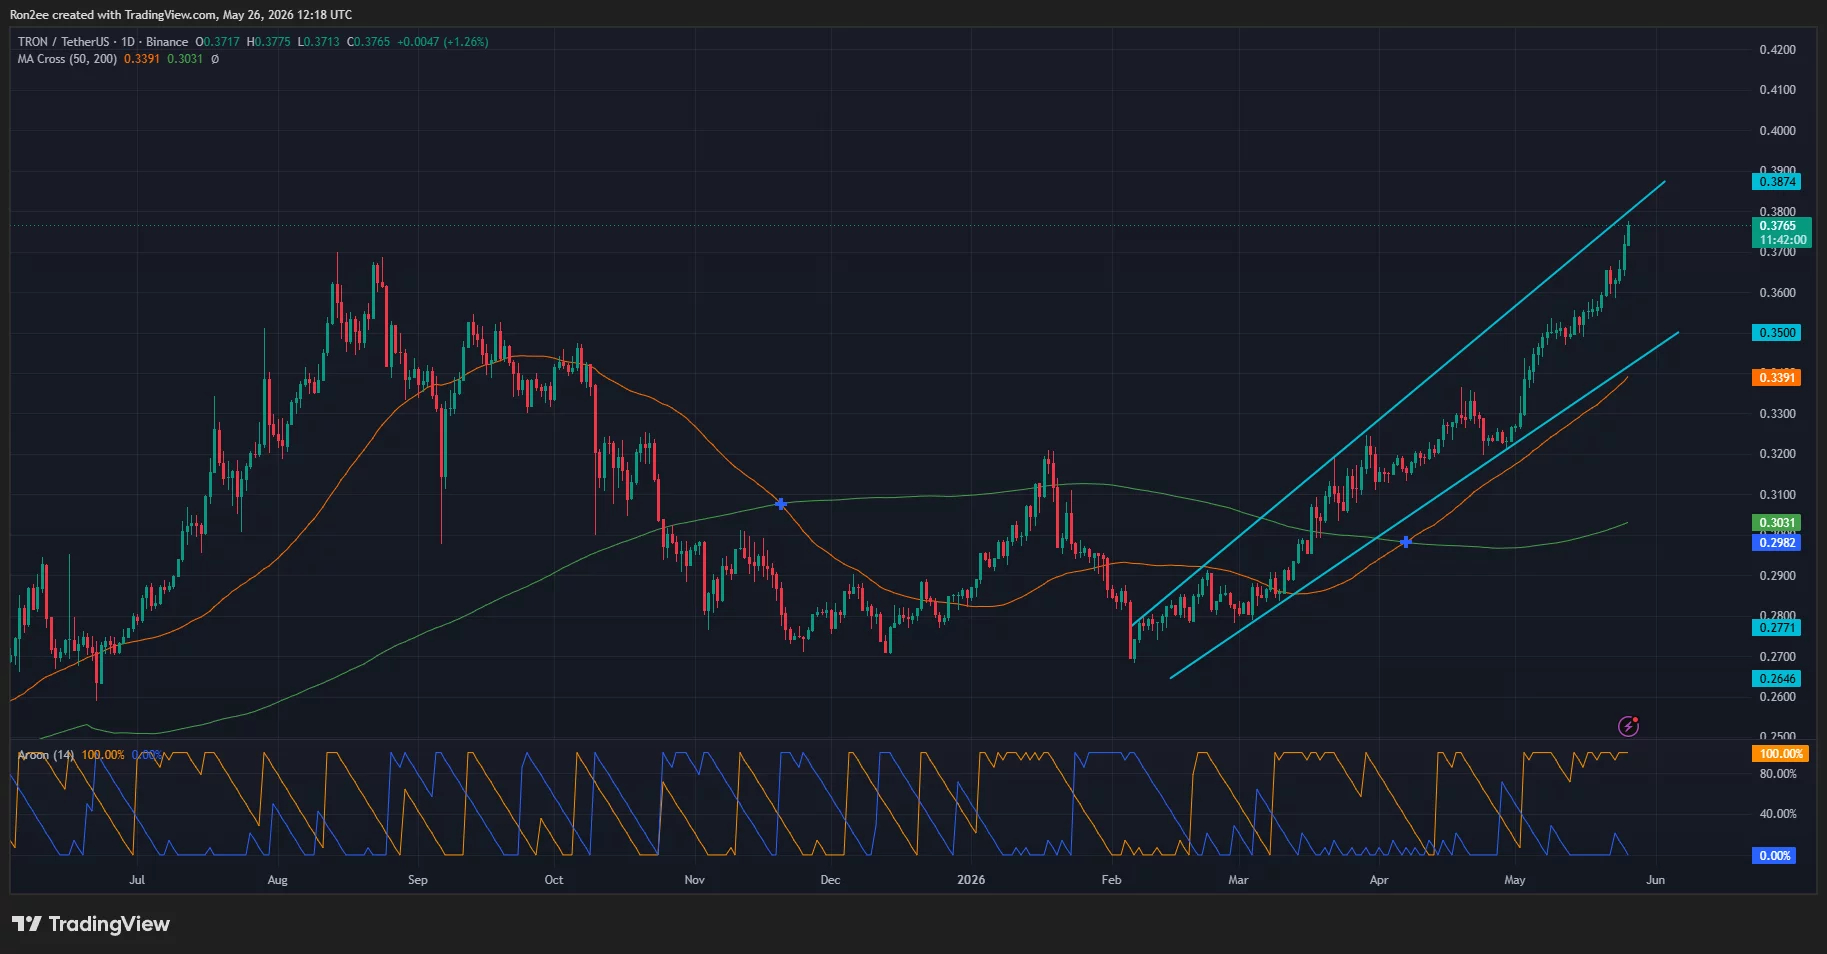
The 50-day moving average near $0.339 has continued trending upward and now sits well above the 200-day moving average around $0.303, preserving a bullish medium-term structure. Tron has also maintained consecutive higher highs and higher lows for nearly three months without breaking below key trend support.
On the weekly timeframe, the token confirmed a large W-shaped reversal pattern after reclaiming resistance near $0.33 earlier this month. The breakout completed a multi-month accumulation structure that formed between November 2025 and March 2026.
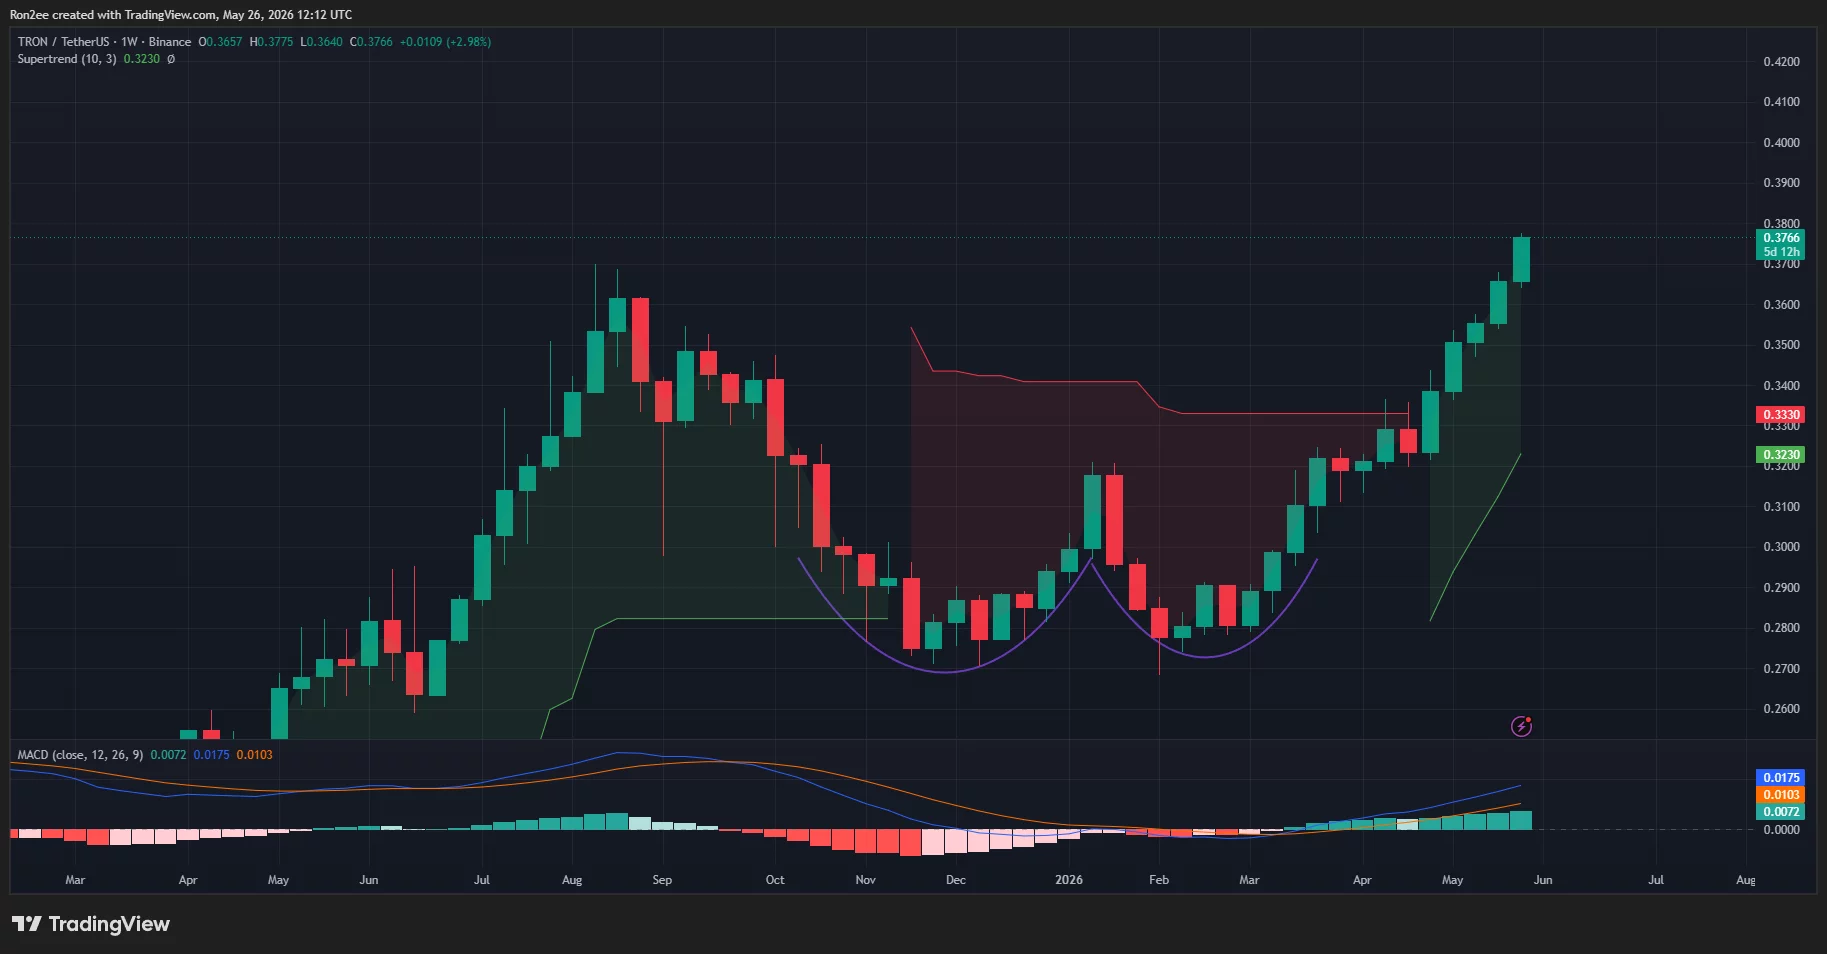
The weekly MACD histogram has continued expanding higher while both MACD lines remain above the zero axis. Momentum indicators have strengthened alongside the breakout instead of diverging from price, reducing the probability of an immediate trend exhaustion event.
Aroon Up currently sits near 100 while Aroon Down remains near zero on the daily timeframe, showing buyers have maintained dominant trend control throughout May. The indicator has historically stayed elevated during prolonged directional rallies rather than short-lived speculative spikes.
Immediate resistance now sits between $0.387 and $0.40, where the upper channel boundary intersects with the next major psychological barrier. A confirmed breakout above that region could open the path toward the $0.42 to $0.45 range based on the height of the weekly reversal structure.
Failure to clear the resistance band could still trigger a temporary cooldown toward the 50-day moving average near $0.339. Beneath that level, traders will likely watch the lower ascending channel support near $0.35, followed by the 200-day moving average around $0.303.
Disclosure: This article does not represent investment advice. The content and materials featured on this page are for educational purposes only.


You May Also Like

Pragmatic Play Slots at Crypto Casinos: Best Titles & Max Wins

ETH Enters High-Stakes Decision Zone

Santos Muscle Nutrition Announces U.S. Expansion Through Walmart.com


Trending News
More24/7 Live News
MoreQuick Reads
More
