

AI Narrative Returns as Render Surges 35% – How High Can RENDER Price Go This Cycle?
Render has quietly returned to one of its most important price zones after weeks of recovery, and the latest on chain data now points to a level of network activity not seen in months. RENDER price climbed more than 35% since the May 19 retest, and the recovery came at a time when AI focused crypto projects started drawing fresh attention again. That combination has started raising a serious question across the market. Could Render be preparing for a much larger breakout later this cycle?
Recent activity from blockchain analytics platform Santiment adds more weight to that possibility. The data showed daily active addresses on the Render network climbing to 394 in a single day. New wallet creation also jumped to 118. Both figures marked their highest readings in nearly 12 weeks.
That reaction matters because active wallet growth usually points to renewed participation across the ecosystem. Fresh wallet creation also shows that new users may be entering the network again after months of weaker activity.
Render On Chain Growth Shows AI Narrative May Still Be Alive
The latest Render metrics arrived during a period where AI infrastructure discussions returned across both crypto and traditional technology markets. Render has continued positioning itself as a decentralized GPU network that supports AI training, rendering workloads, and machine learning infrastructure.
Santiment explained that much of Render’s recovery throughout 2026 has centered around expanding GPU capabilities and infrastructure growth. The network has continued integrating more advanced NVIDIA hardware and expanding available GPU resources.
That detail becomes important because Render sits directly inside one of crypto’s strongest narratives this cycle. AI related projects often react aggressively once liquidity rotates back into the sector.
RENDER price moving back above $2.25 for the first time in over 4 months now places the asset near a key technical area where larger recoveries often begin.
Render Price Structure Now Shows A Successful Breakout Retest
A closer look at the RENDER chart shows another important development that deserves attention.
Earlier in May, Render price finally broke above a descending channel structure that had controlled price action for months. That breakout became more important after the asset returned to retest the top of the channel as support.
So far, buyers have successfully defended that zone.
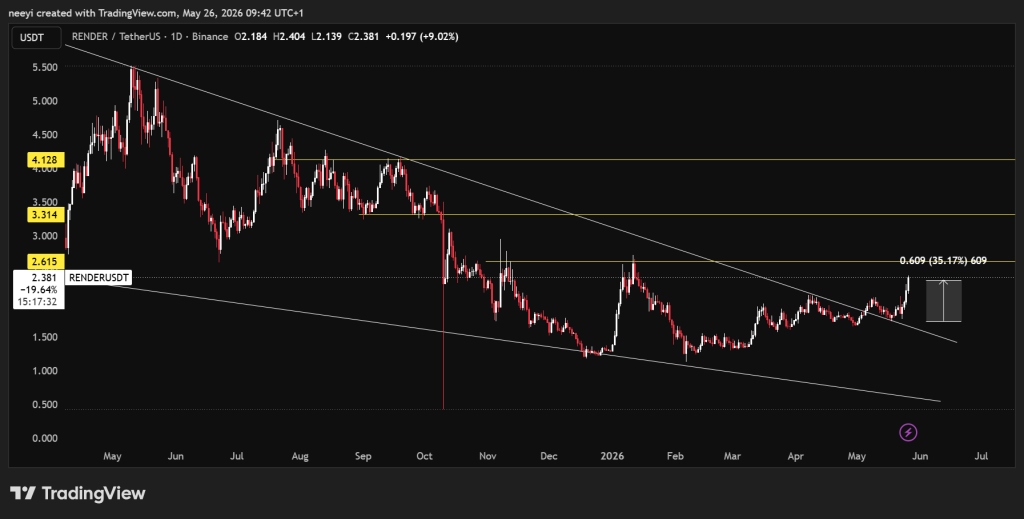 RENDER Price Chart / TradingView.com
The current structure now shows RENDER price attempting to build a higher base above the old resistance area. Technical traders usually watch those retests carefully because successful retests often create the foundation for continuation rallies.
The first major resistance level now sits around $2.6.
A clean move above that zone could open the door toward the next resistance around $3.3. Another breakout afterward could place $4.1 into focus.
Another factor still deserves attention though. The larger market structure remains bearish on higher timeframes. Render has remained inside a broader downtrend structure since May 2025. That means bulls still need several strong confirmations before the larger trend fully changes direction.
Current indicator readings now show strong short term momentum across the RENDER chart. Some indicators also show that price may be entering overheated territory after the recent recovery.
| Name of Indicator | Metrics | Interpretation of Readings |
|---|---|---|
| RSI(14) | 77.798 | Overbought conditions now exist after the recent rally. Price may need consolidation before another strong move higher. |
| STOCH(9,6) | 57.045 | Buy signal remains active. Momentum still favors buyers for now. |
| MACD(12,26) | 0.094 | Bullish crossover structure continues supporting upward momentum. |
| CCI(14) | 226.33 | Market conditions remain overheated short term after the sharp recovery. |
A look at the RENDER chart shows momentum indicators still leaning bullish overall despite short term overheating conditions.
That combination usually creates two possible outcomes.
The first scenario involves consolidation above the breakout zone before another upward attempt. The second scenario involves a stronger continuation move if buyers push price through the $2.6 resistance area quickly.
Related Article: ONDO vs. RENDER: Both Down 80%+ From ATH – Which Is the Better Bet for Next Bull Run?
Long Term Analyst Outlook Points Toward Possible $20 RENDER Price Scenario
Crypto analyst make sense believes the larger RENDER structure may still support a much bigger cycle move later on.
The analyst explained that Render spent years compressing near lower levels before forming what appears to be a long term higher low structure after its deep correction from previous highs.
That detail matters because higher low formations often appear during early reversal stages in larger market cycles.
The analyst identified $14 as the first major reclaim zone. Another major breakout continuation area sits close to $20.
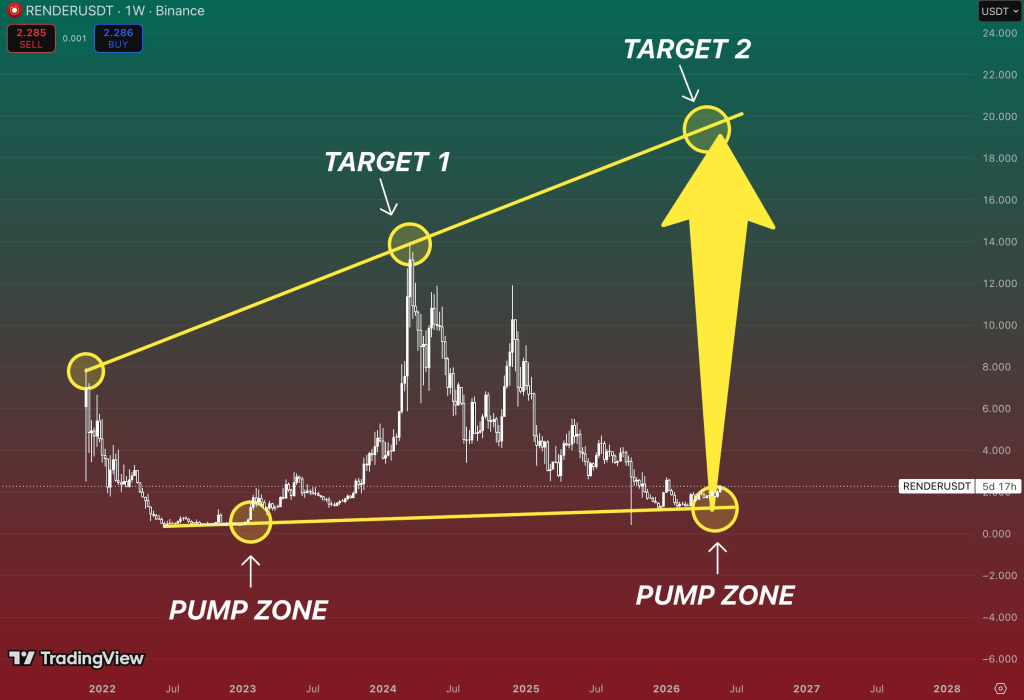 @0xmakesense / X
A look at the long term RENDER chart also shows price following an ascending broadening channel structure over time. Returning toward the upper boundary of that pattern during a strong bull market could theoretically place the $20 region back into focus.
The analyst also noted that AI-focused projects often react quickly once sector momentum returns. Historical crypto cycles show that strong narrative sectors usually move aggressively once capital rotates back into them.
Render still remains far below previous cycle highs, which means the asset has room for larger percentage recoveries if broader crypto conditions improve later this year.
FAQs
Subscribe to our YouTube channel for daily crypto updates, market insights, and expert analysis.
The post AI Narrative Returns as Render Surges 35% – How High Can RENDER Price Go This Cycle? appeared first on CaptainAltcoin.


You May Also Like

XRP Shows Growing Upside Momentum Through The Whale Vs Retail Delta – What’s Next?

XRP Price Prediction Stalls While Pepeto Locks $10M Before Listing

The MrBeast Unofficial Meme Coin Presale Ends Amid Hype



