

Dogecoin price pinned at $0.10; risk-off tape sets stage for rapid break
Amid a cautious crypto tape, Dogecoin price is glued to the $0.10 round number while broader markets trade defensively. With Bitcoin dominance elevated and the fear gauge at 34, volatility looks compressed at a make-or-break level.
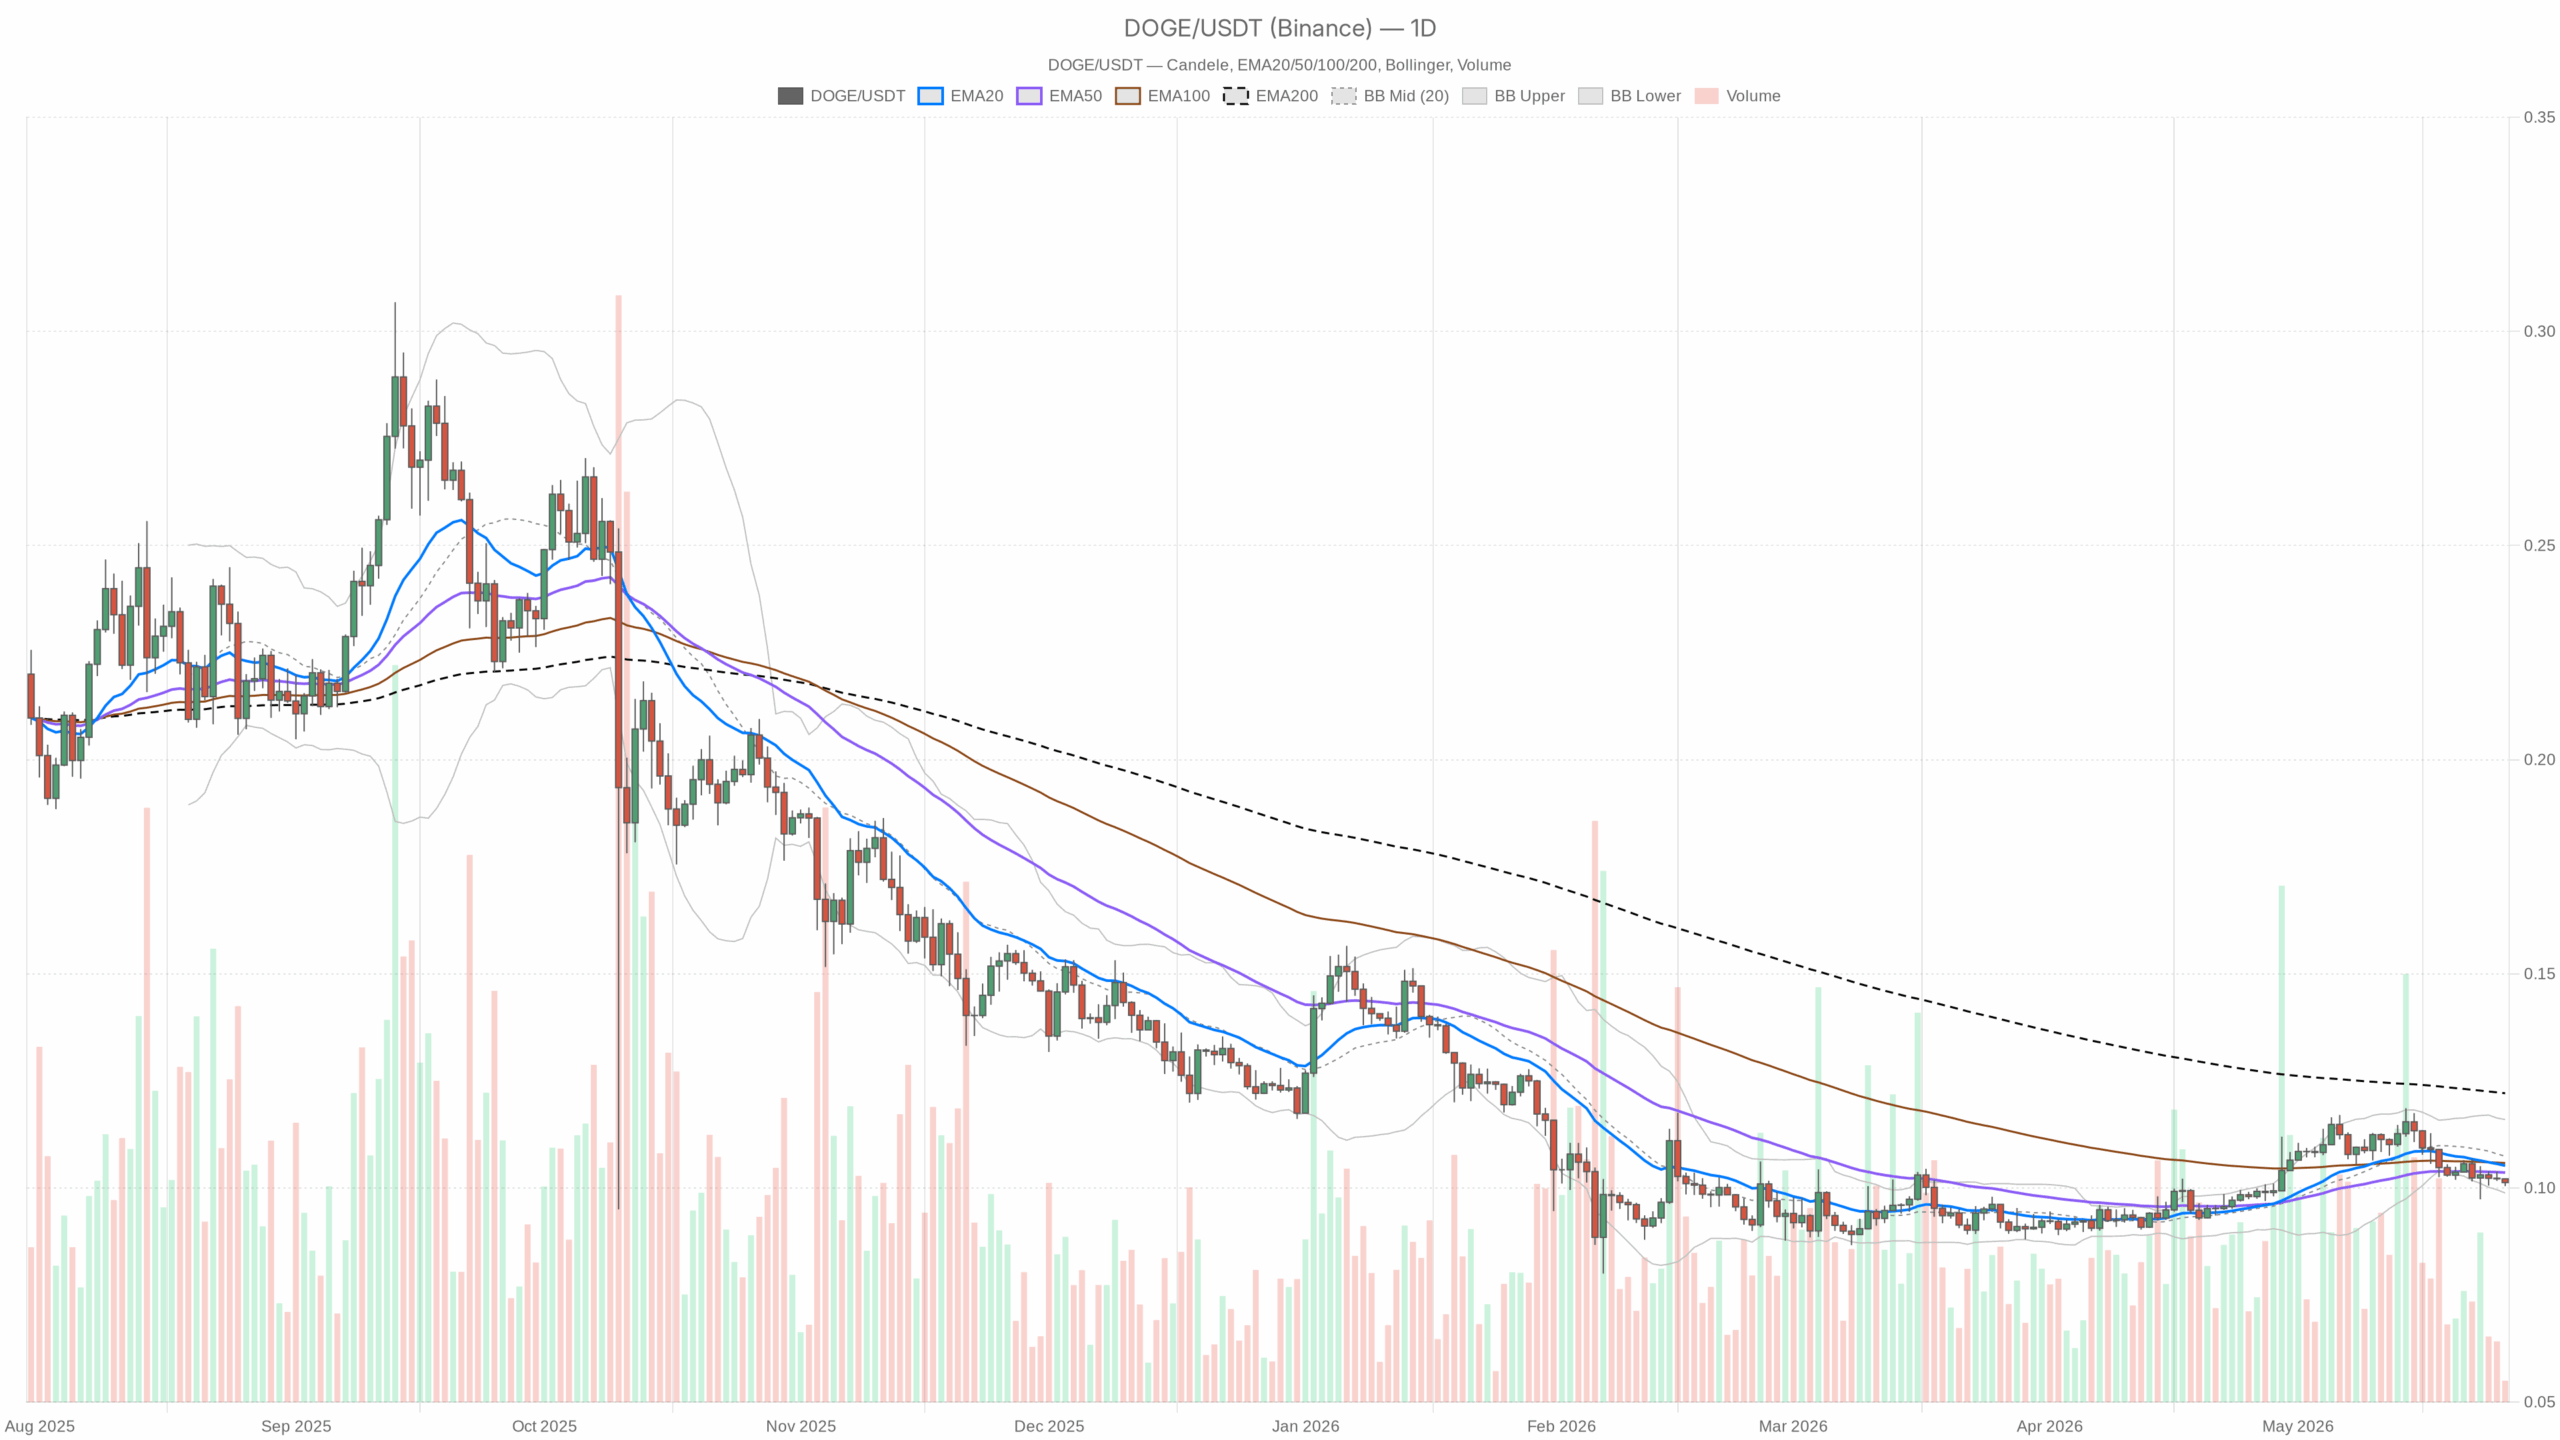 DOGE/USDT — daily chart with candlesticks, EMA20/EMA50 and volume.
Multi-timeframe stance
Main scenario (based on D1): Neutral, bearish-leaning. Price is below the 20- and 200-day averages and parked at the 50-day/round-number shelf. That said, the daily sets the macro bias. The 1H is currently soft and does not contradict a cautious stance. The 15m is only for execution around the break or bounce.
Daily evidence (D1)
- EMA (20/50/200): 20D ≈ 0.11, 50D ≈ 0.10, 200D ≈ 0.12; close ≈ 0.10. Price is capped beneath the 20D and 200D while clinging to the 50D, keeping the short-term trend against bulls and framing $0.10 as last-ditch support.
- RSI (14): 41.71 — Sub-50 momentum points to weak buy-side impulse. There is room lower without being oversold, so bounces need evidence rather than hope.
- MACD: Flat near zero — No actionable momentum signal. This is drift territory until expansion shows up.
- Bollinger Bands: Mid ≈ 0.11, Upper ≈ 0.12, Lower ≈ 0.10; price hugging the lower band. Pressing the lower band often continues until mean reversion wins or support breaks. The next session or two should resolve.
- ATR (14): ≈ 0.00 — The feed prints near-zero range, a sign of extreme compression. Expect a volatility expansion soon, which usually rewards breakout discipline over range fading.
- Pivots: PP/R1/S1 all clustered around 0.10. The market is fixated on the round-number pivot; a decisive move away from $0.10 will likely define the day’s direction.
Intraday context
- 1H regime: Bearish; close ≈ 0.10 with 20/50/200 EMAs flat around price. Structure tilts lower but lacks separation; sellers have control only as long as $0.10 keeps failing on bounces.
- 1H RSI: 41.2 — Momentum is negative but not exhausted; pressure can persist absent a catalyst.
- 1H MACD: Flat — Confirms lack of trend strength; wait for slope and expansion to trust a move.
- 1H Bands: Centered near 0.10 with tight width. Narrow bands amplify the odds of a sharp break once price escapes the clamp.
- 15m regime: Bearish; RSI 45.3 — Micro timeframe shows sell-the-bounce behavior, but a slight uptick can seed a squeeze if $0.10 flips to support.
Market logic
On the daily, the trend cue from trading below the 20D and 200D favors continuation lower. However, price is parked at the 50D and the lower Bollinger band, where mean reversion likes to start. Momentum is muted, so structure around $0.10 will decide the next leg. Moreover, fear readings and high BTC dominance argue for defense. In this tape, failed breakdowns can squeeze hard, but clean breakdowns tend to travel once they get going.
Bullish path
If buyers reclaim the 20D EMA (~$0.11) and hold intraday pullbacks above $0.10–$0.101, the path opens toward the Bollinger mid (~$0.11), then the upper band and 200D near $0.12. A 1H higher-low above $0.10 with MACD turning up would be the tell. Invalidation: a clean 1H close back under $0.10 after a breakout, or a daily close beneath the lower band that is not immediately reclaimed.
Bearish path
If $0.10 gives way on expanding 1H ranges and the 15m fails to retake it on backtests, expect continuation into $0.095 first, then $0.090 if risk-off accelerates. The daily RSI has room to travel lower, so the slide can extend before dip demand shows. Invalidation: a daily close back above ~$0.11 (20D EMA) that flips intraday structure to higher highs and higher lows.
Positioning and risk
With Dogecoin price coiled at a round-number magnet and ATR effectively pinned, the next move is likely to be fast. Therefore, position sizing should assume a volatility expansion. Breakout traders can wait for a decisive move away from $0.10 with the 15m holding the retest. Mean-reversion traders need the daily reclaim of the 20D to avoid catching a falling knife. The tape is conflicted and the broader market is cautious, so respect potential fakeouts around $0.10 and adjust stops accordingly.
In sum, $0.10 is the pivot. Compression and a risk-off backdrop argue for patience until expansion confirms direction, with the next 1–2 sessions likely decisive.


You May Also Like

Pony AI Inc. (PONY) Stock: Q1 Revenue Jumps 145% as Robotaxi Growth Accelerates

Taiwan market value TSMC story lifts stocks to $4.95T, just ahead of India

Solana Price Prediction: SOL Slides Below $80 As $270M Hack Triggers Selloff



