

Analyst Reveals Why Hyperliquid Price May Hit $350 on Cheap Leverage
Key Insights:
- HYPE ETFs recorded $72.38M in inflows last week as Hyperliquid traded near record highs above $60.
- Analyst Capital Flows says cheap leverage and funding rates could drive larger capital flows into Hyperliquid crypto.
- Hyperliquid’s assistance fund holds 44.52M HYPE after buybacks removed about 210,000 tokens last week.
Hyperliquid remained one of the strongest-performing crypto assets this week after HYPE climbed to a new all-time high near $64.48. The rally accelerated as ETF inflows, buybacks, and derivatives activity continued expanding simultaneously.
Analysts also pointed to a broader macro narrative developing around the protocol. Some traders believe Hyperliquid could attract larger institutional flows if it continues offering deeper liquidity and cheaper leverage than rival venues.
Cheap Leverage Became Central to Hyperliquid’s Growth Narrative
The bullish thesis increasingly revolves around funding efficiency and leverage costs across trading markets.
According to Capital Flows, large pools of capital usually migrate toward venues offering stronger liquidity, tighter execution, and lower borrowing costs. The analyst argued Hyperliquid may benefit if its funding structure remains more competitive than centralized exchanges and rival decentralized platforms.
That view positions Hyperliquid as more than a crypto-native trading venue. Supporters increasingly frame it as infrastructure capable of supporting broader capital markets tied to foreign exchange, rates, and leveraged trading strategies.
If funding costs remain attractive, larger firms could gradually shift more trading activity onto the platform.
However, institutional participation still depends heavily on regulatory clarity. Many traditional firms remain restricted from deploying substantial capital into on-chain derivatives markets without clearer legal frameworks.
Even so, analysts believe liquidity could scale rapidly if Hyperliquid continues demonstrating stable execution under heavier trading conditions.
Institutional Demand Adds Fuel to HYPE Token Rally
Hype token is already seeing stronger demand from institutional products. HYPE-focused ETFs from 21Shares and Bitwise recorded $72.38 million in inflows last week, after $2.52 million in the prior week. That increase shows rising demand from investors seeking exposure to the token through regulated products.
The inflows come as HYPE trades in price discovery. Hyperliquid moved above $60 on Monday after a 7% gain the previous day. The token reached a record high of $64.48, supported by stronger spot demand and growing interest in the platform’s trading activity.
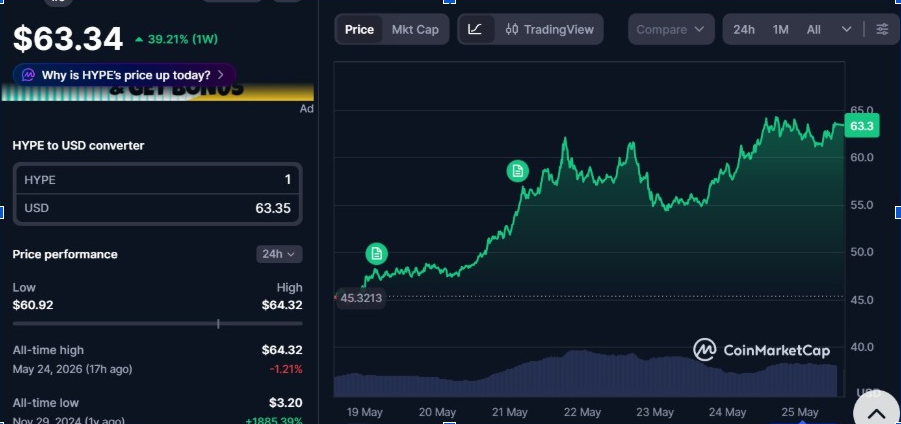 HYPEUSD 1-Week Chart | Source: CoinMarketCap
Derivatives data also shows rising participation. HYPE futures open interest climbed to a record $2.95 billion, according to CoinGlass data cited in the report. Higher open interest shows that traders are building larger positions, although it can also raise volatility if leverage becomes crowded.
Retail demand remains another factor behind the rally. A rising token price often attracts shorter-term traders, especially after a breakout to new highs. Even so, the stronger institutional flows suggest the move is not only driven by retail momentum.
Buybacks Support HYPE Price Structure
Hyperliquid’s token model also remains central to the bullish case. The platform directs about 97% to 99% of trading fees toward HYPE buybacks, which are then transferred to its assistance fund. This structure links higher trading activity to steady token demand.
Hyperscreener data shows about 210,000 HYPE tokens were bought back last week. The assistance fund now holds 44.52 million HYPE tokens, including 26.81 million tokens purchased through buybacks.
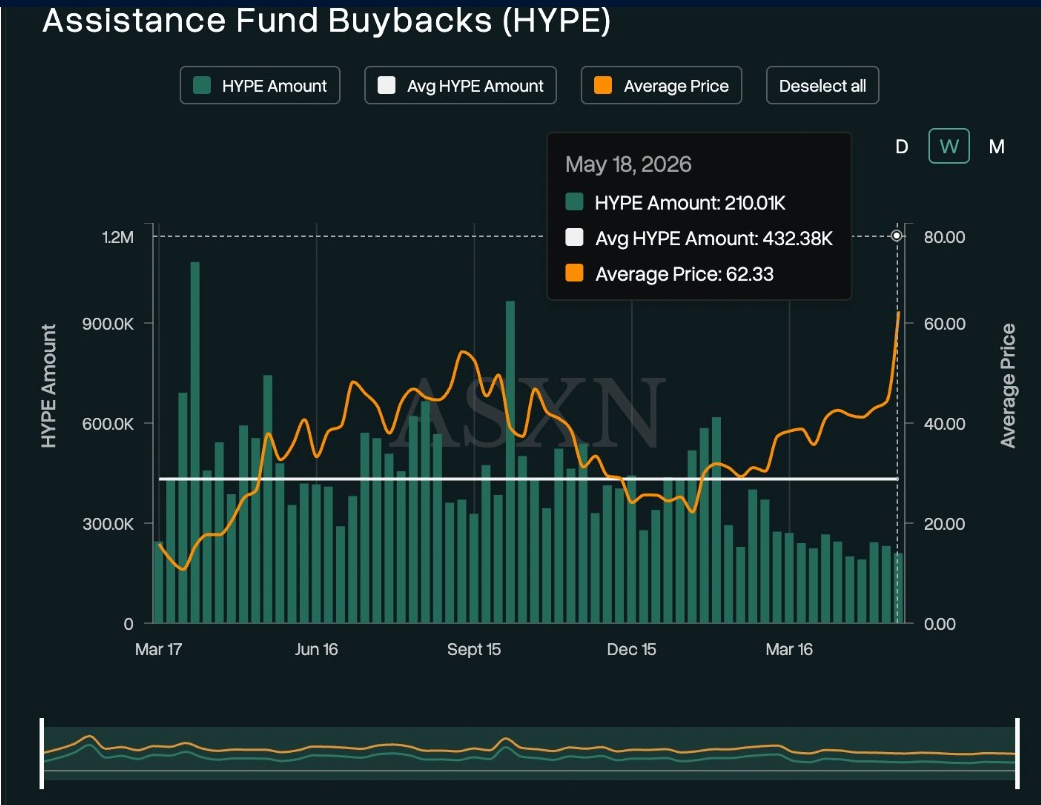 HYPE tokens buyback | Source: Hyperscreener
Hyperliquid’s buyback model gives HYPE a direct link to platform revenue. When trading volume rises, the exchange collects more fees, which can increase the amount used for token purchases. That structure ties market activity on Hyperliquid to steady HYPE accumulation.
However, the model does not remove downside risk. HYPE is trading near record highs, where some holders may take profit after the latest rally. Funding-rate changes, ETF flow trends, and broader market sentiment could still influence the next move.
HYPE Token Technical Setup Points Toward Higher Levels
HYPE’s chart remains strong after price cleared the previous swing high near $59.45. The token also holds above its 50-day, 100-day, and 200-day exponential moving averages, showing that buyers still control the short- and medium-term trend.
HYPE token resistance now sits near the 127.2% and 161.8% Fibonacci extension levels at $70.04 and $83.51. A break above those areas could keep the rally active, especially if ETF inflows continue, buybacks remain steady, and open interest stays elevated.
 HYPEUSD 1-Day Chart | Source: TradingView
However, the Relative Strength Index near 75 indicates the market has moved quickly. A pullback toward $59.45 could test whether buyers defend the former resistance as support.
The post Analyst Reveals Why Hyperliquid Price May Hit $350 on Cheap Leverage appeared first on The Market Periodical.


You May Also Like

Bitcoin: volatility at its lowest in the last nine months

Pony AI Inc. (PONY) Stock: Q1 Revenue Jumps 145% as Robotaxi Growth Accelerates

Taiwan market value TSMC story lifts stocks to $4.95T, just ahead of India



