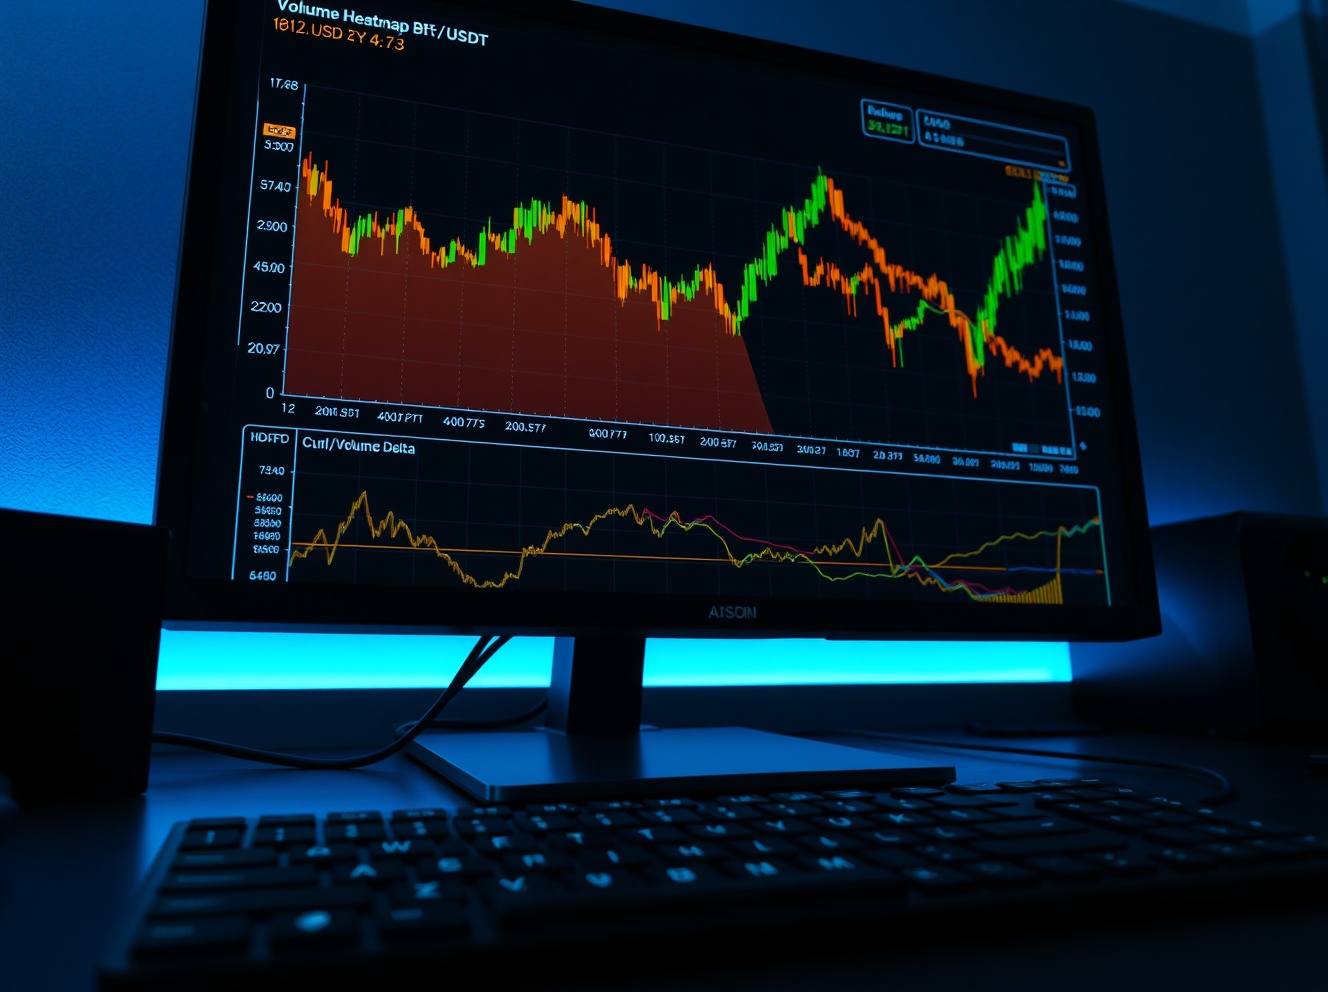
BitcoinWorld BTC/USDT Spot CVD Chart Analysis: Volume Heatmap and Order Flow Insights as of May 25 As of 10:00 a.m. UTC on May 25, 2025, the BTC/USDT spot pairBitcoinWorld BTC/USDT Spot CVD Chart Analysis: Volume Heatmap and Order Flow Insights as of May 25 As of 10:00 a.m. UTC on May 25, 2025, the BTC/USDT spot pair

BTC/USDT Spot CVD Chart Analysis: Volume Heatmap and Order Flow Insights as of May 25

2026/05/25 18:25
3 min read
For feedback or concerns regarding this content, please contact us at crypto.news@mexc.com

BitcoinWorld

BTC/USDT Spot CVD Chart Analysis: Volume Heatmap and Order Flow Insights as of May 25

As of 10:00 a.m. UTC on May 25, 2025, the BTC/USDT spot pair is showing notable activity in its order book, as visualized by the Spot Cumulative Volume Delta (CVD) chart. This chart provides traders with a granular view of buying and selling pressure at different price levels and trade sizes.

Understanding the Volume Heatmap

The top section of the chart features a Volume Heatmap, which tracks the volume of trades executed at specific price points. In this heatmap, the background color becomes brighter in price ranges where the price lingers or moves significantly. These brighter areas can act as potential support or resistance levels, as they represent zones where substantial trading activity has occurred. For traders, identifying these zones can help in anticipating where the price might react in the near term.

Cumulative Volume Delta (CVD) Breakdown

The bottom section of the chart displays the Cumulative Volume Delta (CVD) indicator, which categorizes buy and sell orders by trade size. As buy orders increase, the corresponding colored line rises, providing a clear visual of order flow dynamics. For instance, the yellow line tracks orders between $100 and $1,000, representing smaller retail trades. The brown line, in contrast, represents large orders ranging from $1 million to $10 million, often associated with institutional activity. The divergence or convergence of these lines can signal shifts in market sentiment.

Implications for Traders

This chart is particularly useful for intraday traders and scalpers who rely on order flow analysis to make informed decisions. By monitoring the CVD, traders can gauge whether buying or selling pressure is dominant at a given moment. A rising CVD line for large orders (brown line) could indicate institutional accumulation, while a declining line might suggest distribution. The Volume Heatmap adds an extra layer of context, highlighting price levels where significant volume has already been traded.

Conclusion

The BTC/USDT spot CVD chart as of May 25 offers a detailed snapshot of current market dynamics. By combining the Volume Heatmap with the CVD indicator, traders can identify key support and resistance zones and assess the strength of buying or selling pressure. This analysis remains a valuable tool for short-term trading strategies, though it should be used alongside other technical and fundamental indicators for a comprehensive view.

FAQs

Q1: What is the Cumulative Volume Delta (CVD) indicator?
The CVD indicator tracks the cumulative difference between buying and selling volume, categorized by trade size. It helps traders understand whether buying or selling pressure is dominant at a given time.

Q2: How does the Volume Heatmap work?
The Volume Heatmap displays the volume of trades at specific price levels. Brighter colors indicate higher trading activity, which can act as potential support or resistance zones.

Q3: Why are large orders (brown line) significant?
The brown line represents orders between $1 million and $10 million, often associated with institutional investors. Changes in this line can signal large-scale accumulation or distribution, influencing market direction.

This post BTC/USDT Spot CVD Chart Analysis: Volume Heatmap and Order Flow Insights as of May 25 first appeared on BitcoinWorld.


Market Opportunity
Bitcoin Logo
Bitcoin Price(BTC)
$76,677.04
$76,677.04$76,677.04
-1.22%
USD
Bitcoin (BTC) Live Price Chart

AI Strategy: Powered 24/7

AI Strategy: Powered 24/7AI Strategy: Powered 24/7

Generate automated strategies using natural language

Disclaimer: The articles reposted on this site are sourced from public platforms and are provided for informational purposes only. They do not necessarily reflect the views of MEXC. All rights remain with the original authors. If you believe any content infringes on third-party rights, please contact crypto.news@mexc.com for removal. MEXC makes no guarantees regarding the accuracy, completeness, or timeliness of the content and is not responsible for any actions taken based on the information provided. The content does not constitute financial, legal, or other professional advice, nor should it be considered a recommendation or endorsement by MEXC.

You May Also Like

Franklin Templeton CEO Dismisses 50bps Rate Cut Ahead FOMC

Franklin Templeton CEO Dismisses 50bps Rate Cut Ahead FOMC

The post Franklin Templeton CEO Dismisses 50bps Rate Cut Ahead FOMC appeared on BitcoinEthereumNews.com. Franklin Templeton CEO Jenny Johnson has weighed in on whether the Federal Reserve should make a 25 basis points (bps) Fed rate cut or 50 bps cut. This comes ahead of the Fed decision today at today’s FOMC meeting, with the market pricing in a 25 bps cut. Bitcoin and the broader crypto market are currently trading flat ahead of the rate cut decision. Franklin Templeton CEO Weighs In On Potential FOMC Decision In a CNBC interview, Jenny Johnson said that she expects the Fed to make a 25 bps cut today instead of a 50 bps cut. She acknowledged the jobs data, which suggested that the labor market is weakening. However, she noted that this data is backward-looking, indicating that it doesn’t show the current state of the economy. She alluded to the wage growth, which she remarked is an indication of a robust labor market. She added that retail sales are up and that consumers are still spending, despite inflation being sticky at 3%, which makes a case for why the FOMC should opt against a 50-basis-point Fed rate cut. In line with this, the Franklin Templeton CEO said that she would go with a 25 bps rate cut if she were Jerome Powell. She remarked that the Fed still has the October and December FOMC meetings to make further cuts if the incoming data warrants it. Johnson also asserted that the data show a robust economy. However, she noted that there can’t be an argument for no Fed rate cut since Powell already signaled at Jackson Hole that they were likely to lower interest rates at this meeting due to concerns over a weakening labor market. Notably, her comment comes as experts argue for both sides on why the Fed should make a 25 bps cut or…
Share
BitcoinEthereumNews2025/09/18 00:36
Gold Spot Volume on Binance Surges to $80M as Demand Extends Beyond Futures

Gold Spot Volume on Binance Surges to $80M as Demand Extends Beyond Futures

TLDR: Gold spot trading on Binance reached nearly $80M shortly after launch, showing rapid market adoption. Despite a 15% correction, gold continues attracting
Share
Blockonomi2026/04/02 18:18
John Thune warns GOP rank and file as mission creep threatens to blow up MAGA plan

John Thune warns GOP rank and file as mission creep threatens to blow up MAGA plan

Republicans now plan to do another round of reconciliation to pass parts of their agenda Democrats oppose — but already, cracks are starting to show in the strategy
Share
Rawstory2026/04/02 20:48

No Chart Skills? Still Profit

No Chart Skills? Still ProfitNo Chart Skills? Still Profit

Copy top traders in 3s with auto trading!