Bitcoin just slipped under $111,000, raising fears of a deeper correction. Will BTC rebound from support, or is a crash below $110,000 looming?Bitcoin just slipped under $111,000, raising fears of a deeper correction. Will BTC rebound from support, or is a crash below $110,000 looming?

Breaking: Bitcoin Price Drops Below $111,000 and Here's What's Next

2025/09/25 23:19
2 min read
For feedback or concerns regarding this content, please contact us at crypto.news@mexc.com

Bitcoin Price Dips Below $111,000

Bitcoin ($BTC) has fallen under the $111,000 mark, sparking renewed concerns across the crypto market. The latest drop represents a decisive test of Bitcoin’s resilience as traders eye critical support zones for clues about the next move. BTC is trading at $110,983, slipping under short-term moving averages, with the 50-day SMA ($114,262) now acting as resistance.

BTCUSD_2025-09-25_16-56-36.png

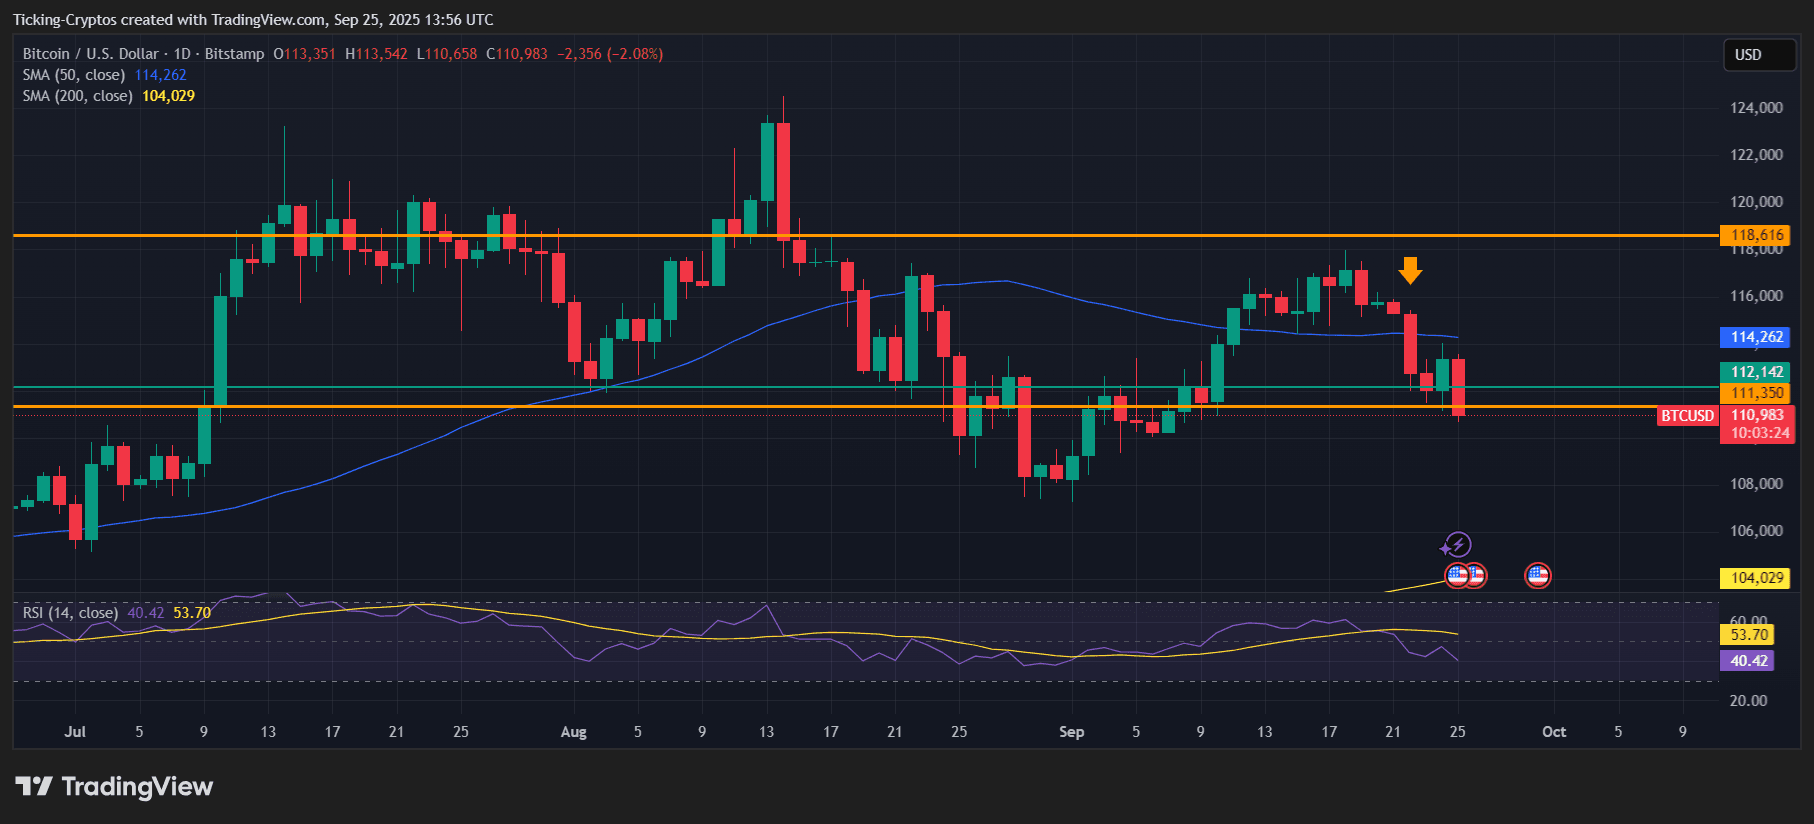
BTC/USD 1-day chart - TradingView

Chart Analysis: Support and Resistance

Looking at the daily chart, $Bitcoin is currently sitting just above its true support line at $110,000. This zone has historically been a strong level where buyers tend to step in, preventing deeper sell-offs.

  • Immediate Resistance: $114,200 (50-day SMA)
  • Major Resistance: $118,600
  • Key Support: $111,350 (broken intraday)
  • Critical Support: $110,000

The Relative Strength Index (RSI) is hovering near 40.42, signaling bearish momentum but also nearing oversold territory, where rebounds often occur.

Two Possible Scenarios Ahead

1. Rebound from $110,000

If Bitcoin holds above $110,000, we could see a technical rebound. A bounce here may push BTC back toward the $114,000–$116,000 range, with momentum potentially extending to $118,600 if volume supports the move.

2. Confirmed Crash if $110,000 Breaks

Should Bitcoin close decisively below $110,000, it would confirm a breakdown of critical support. In this case, BTC could accelerate losses, with the next major target aligning near the 200-day SMA ($104,000). A fall below this level risks triggering panic selling, opening the door for an extended bearish cycle.

Market Opportunity
Bitcoin Logo
Bitcoin Price(BTC)
$72,705.59
$72,705.59$72,705.59
-0.93%
USD
Bitcoin (BTC) Live Price Chart
Disclaimer: The articles reposted on this site are sourced from public platforms and are provided for informational purposes only. They do not necessarily reflect the views of MEXC. All rights remain with the original authors. If you believe any content infringes on third-party rights, please contact crypto.news@mexc.com for removal. MEXC makes no guarantees regarding the accuracy, completeness, or timeliness of the content and is not responsible for any actions taken based on the information provided. The content does not constitute financial, legal, or other professional advice, nor should it be considered a recommendation or endorsement by MEXC.

You May Also Like

Microsoft Corp. $MSFT blue box area offers a buying opportunity

Microsoft Corp. $MSFT blue box area offers a buying opportunity

The post Microsoft Corp. $MSFT blue box area offers a buying opportunity appeared on BitcoinEthereumNews.com. In today’s article, we’ll examine the recent performance of Microsoft Corp. ($MSFT) through the lens of Elliott Wave Theory. We’ll review how the rally from the April 07, 2025 low unfolded as a 5-wave impulse followed by a 3-swing correction (ABC) and discuss our forecast for the next move. Let’s dive into the structure and expectations for this stock. Five wave impulse structure + ABC + WXY correction $MSFT 8H Elliott Wave chart 9.04.2025 In the 8-hour Elliott Wave count from Sep 04, 2025, we saw that $MSFT completed a 5-wave impulsive cycle at red III. As expected, this initial wave prompted a pullback. We anticipated this pullback to unfold in 3 swings and find buyers in the equal legs area between $497.02 and $471.06 This setup aligns with a typical Elliott Wave correction pattern (ABC), in which the market pauses briefly before resuming its primary trend. $MSFT 8H Elliott Wave chart 7.14.2025 The update, 10 days later, shows the stock finding support from the equal legs area as predicted allowing traders to get risk free. The stock is expected to bounce towards 525 – 532 before deciding if the bounce is a connector or the next leg higher. A break into new ATHs will confirm the latter and can see it trade higher towards 570 – 593 area. Until then, traders should get risk free and protect their capital in case of a WXY double correction. Conclusion In conclusion, our Elliott Wave analysis of Microsoft Corp. ($MSFT) suggested that it remains supported against April 07, 2025 lows and bounce from the blue box area. In the meantime, keep an eye out for any corrective pullbacks that may offer entry opportunities. By applying Elliott Wave Theory, traders can better anticipate the structure of upcoming moves and enhance risk management in volatile markets. Source: https://www.fxstreet.com/news/microsoft-corp-msft-blue-box-area-offers-a-buying-opportunity-202509171323
Share
BitcoinEthereumNews2025/09/18 03:50
CME to launch Solana and XRP futures options on October 13, 2025

CME to launch Solana and XRP futures options on October 13, 2025

The post CME to launch Solana and XRP futures options on October 13, 2025 appeared on BitcoinEthereumNews.com. Key Takeaways CME Group will launch futures options for Solana (SOL) and XRP. The launch date is set for October 13, 2025. CME Group will launch futures options for Solana and XRP on October 13, 2025. The Chicago-based derivatives exchange will add the new crypto derivatives products to its existing digital asset offerings. The launch will provide institutional and retail traders with additional tools to hedge positions and speculate on price movements for both digital assets. The futures options will be based on CME’s existing Solana and XRP futures contracts. Trading will be conducted through CME Globex, the exchange’s electronic trading platform. Source: https://cryptobriefing.com/cme-solana-xrp-futures-options-launch-2025/
Share
BitcoinEthereumNews2025/09/18 01:07
US-Israel airstrikes trigger 700% surge in Iran crypto outflows

US-Israel airstrikes trigger 700% surge in Iran crypto outflows

The post US-Israel airstrikes trigger 700% surge in Iran crypto outflows appeared on BitcoinEthereumNews.com. Homepage > News > Business > US-Israel airstrikes
Share
BitcoinEthereumNews2026/03/05 16:01