TLDR Bitcoin whales added 236,000 BTC since December 2025, recovering to pre-October 2025 levels Whale exchange flows into Binance hit $8.24 billion over 30 daysTLDR Bitcoin whales added 236,000 BTC since December 2025, recovering to pre-October 2025 levels Whale exchange flows into Binance hit $8.24 billion over 30 days

Bitcoin (BTC) Price: Whales Accumulate While ETFs Post $88M Inflows After Three-Day Losing Streak

2026/02/21 16:02
3 min read

TLDR

  • Bitcoin whales added 236,000 BTC since December 2025, recovering to pre-October 2025 levels
  • Whale exchange flows into Binance hit $8.24 billion over 30 days, a 14-month high
  • Bitcoin ETFs recorded $88 million in net inflows on February 20, ending a three-day outflow streak
  • BlackRock’s IBIT and Fidelity’s FBTC were the only ETFs to record flows on February 20
  • Four weeks of ETF outflows total roughly $2.48 billion, with BTC trading around $67,800

Bitcoin is trading around $67,800 as on-chain data shows large holders have been quietly rebuilding their positions over the past three months.
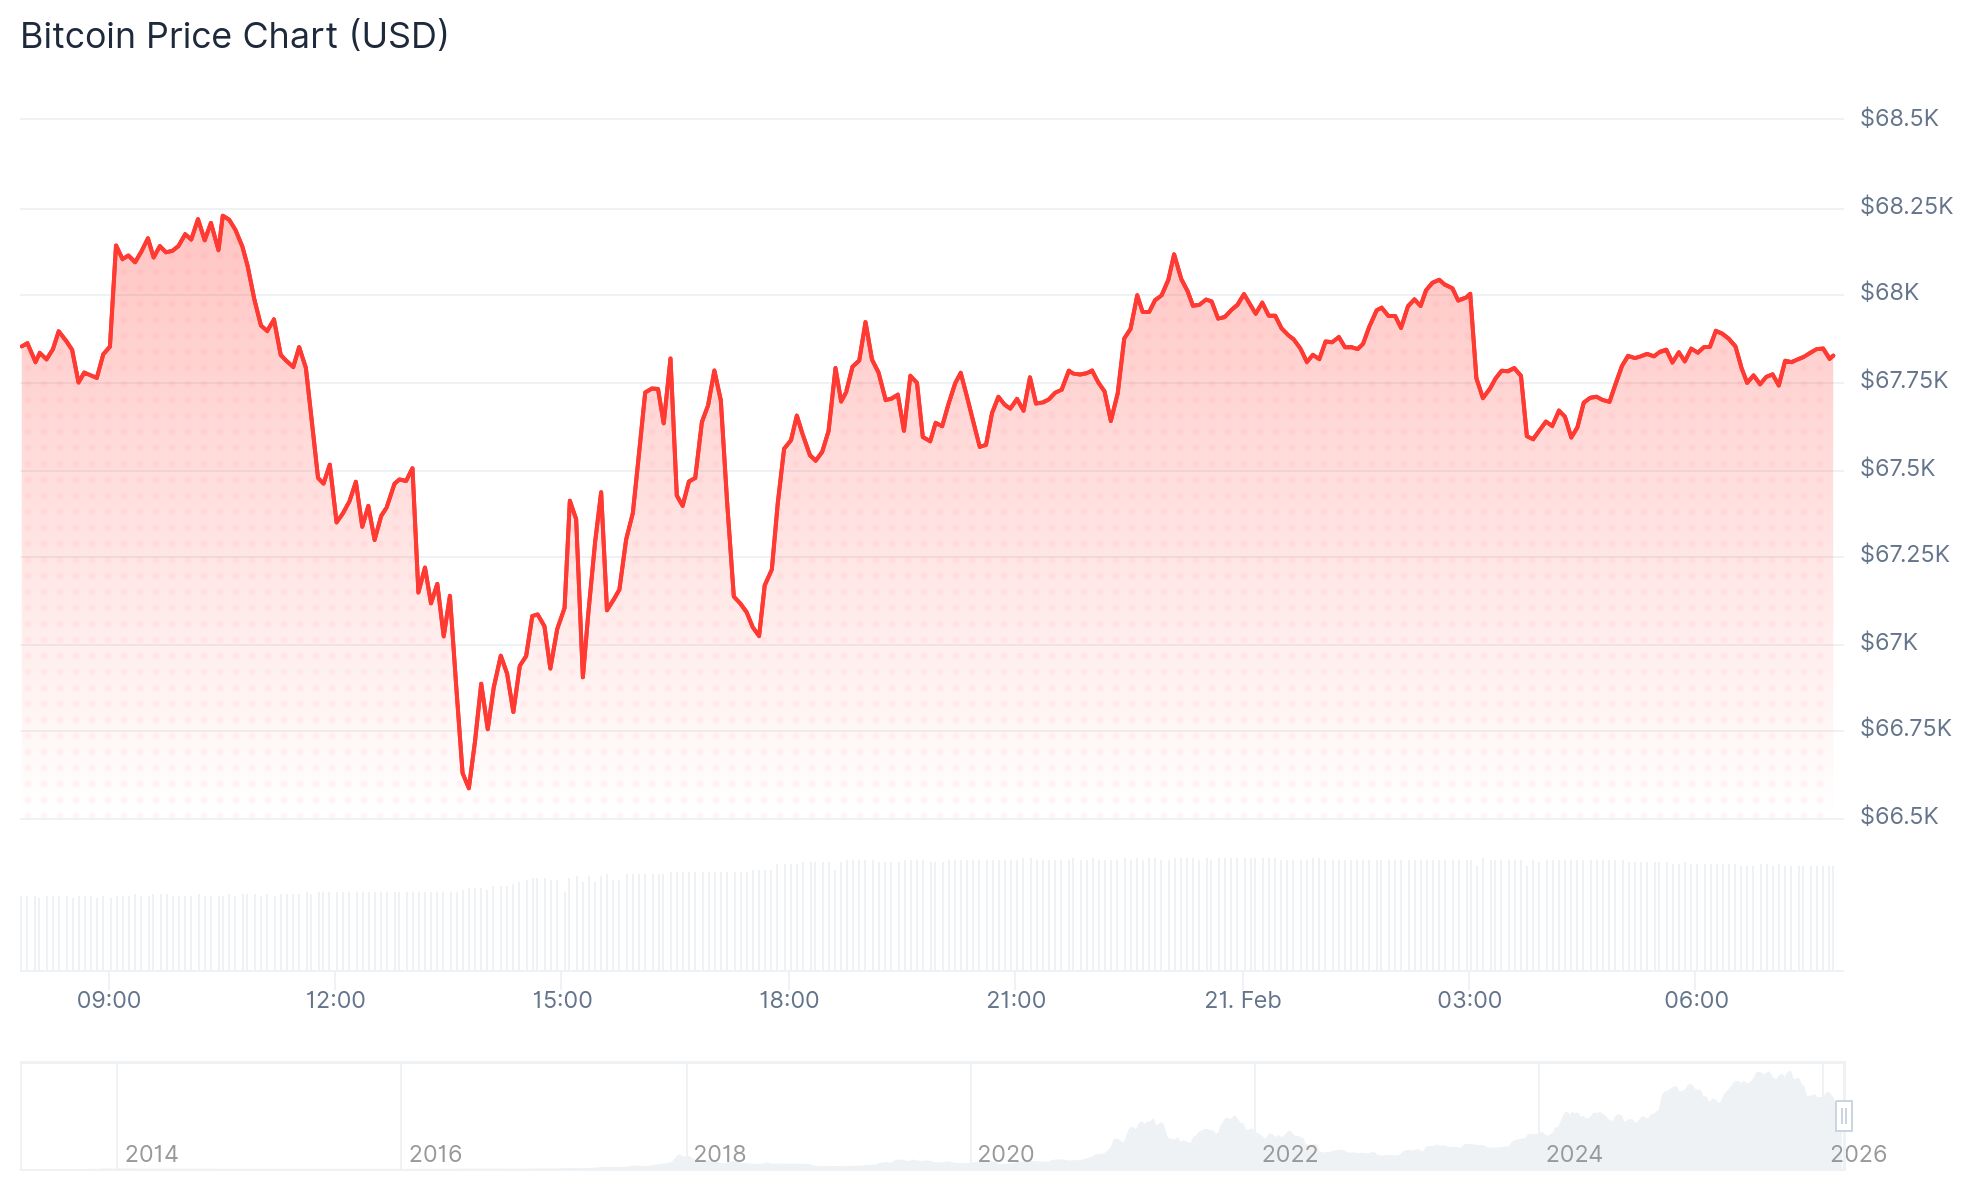
Bitcoin (BTC) PriceBitcoin (BTC) Price

Wallets holding between 1,000 and 10,000 BTC — commonly called whales — increased their total balance from 2.86 million BTC on December 10, 2025, to 3.09 million BTC. That is a 236,000 BTC addition that brings reserves back to levels seen before the October 10, 2025 market crash.

Cryptocurrencies, Bitcoin Price, Markets, Cryptocurrency Exchange, Binance, Price Analysis, Market Analysis, Liquidity, WhaleSource: CryptoQuant

Crypto analyst caueconomy noted that 98,000 BTC of that accumulation happened in just the last 30 days, fully reversing a distribution phase that began after Bitcoin hit $124,000 in August 2025.

Average BTC order sizes on spot markets have ranged between 950 and 1,100 BTC throughout 2026. That is the most consistent stretch of large-ticket buying since September 2024.

Whale Exchange Flows Hit 14-Month High

CryptoQuant analyst maartunn reported $8.24 billion in whale BTC flows into Binance over the past 30 days, the highest level in 14 months. Retail flows came in at $11.91 billion but have flattened over the same period.

Cryptocurrencies, Bitcoin Price, Markets, Cryptocurrency Exchange, Binance, Price Analysis, Market Analysis, Liquidity, WhaleSource: CryptoQuant

The retail-to-whale ratio now sits at 1.45 and is continuing to fall as larger deposits grow.

Glassnode data shows gross exchange whale withdrawals averaging 3.5% of total exchange-held BTC over a rolling 30-day period. That is the strongest pace since November 2024.

Based on current exchange balances, that translates to roughly 60,000 to 100,000 BTC in withdrawals over the past month.

Net exchange balances have remained relatively stable as incoming flows are largely offset by these outbound transfers.

Bitcoin ETFs Return to Inflows

Bitcoin ETFs recorded $88.04 million in net inflows on February 20, ending three straight days of outflows that totaled $403.90 million.
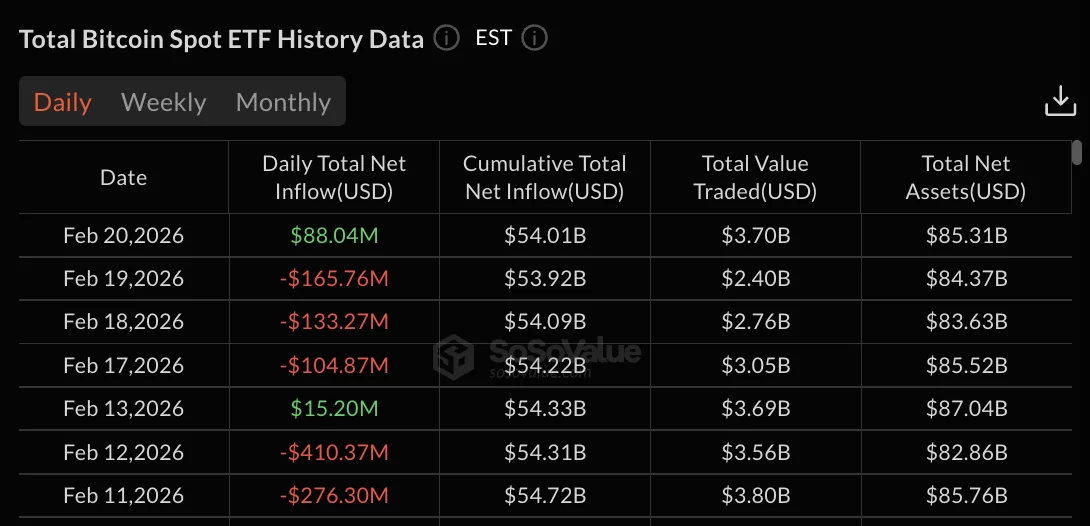
Bitcoin ETF dataSource: SoSoValue

BlackRock’s IBIT led with $64.46 million. Fidelity’s FBTC added $23.59 million. All other ETFs posted zero flows on the day.

February 19 was the worst single day of the streak, with $165.76 million in redemptions. February 18 saw $133.27 million leave, followed by $104.87 million on February 17.

Total net assets across Bitcoin ETFs stood at $85.31 billion on February 20, down from $87.04 billion on February 13.

The four-week outflow period from January 23 through February 20 totals approximately $2.48 billion. Weekly trading volume came in at $11.91 billion for the period ending February 20, down from $18.91 billion the prior week.

BlackRock’s IBIT holds $61.30 billion in cumulative net inflows. Fidelity’s FBTC stands at $10.96 billion.

The post Bitcoin (BTC) Price: Whales Accumulate While ETFs Post $88M Inflows After Three-Day Losing Streak appeared first on CoinCentral.

Market Opportunity
Bitcoin Logo
Bitcoin Price(BTC)
$68,246.14
$68,246.14$68,246.14
-0.53%
USD
Bitcoin (BTC) Live Price Chart
Disclaimer: The articles reposted on this site are sourced from public platforms and are provided for informational purposes only. They do not necessarily reflect the views of MEXC. All rights remain with the original authors. If you believe any content infringes on third-party rights, please contact service@support.mexc.com for removal. MEXC makes no guarantees regarding the accuracy, completeness, or timeliness of the content and is not responsible for any actions taken based on the information provided. The content does not constitute financial, legal, or other professional advice, nor should it be considered a recommendation or endorsement by MEXC.

You May Also Like

Ethereum Price Prediction: ETH Targets $10,000 In 2026 But Layer Brett Could Reach $1 From $0.0058

Ethereum Price Prediction: ETH Targets $10,000 In 2026 But Layer Brett Could Reach $1 From $0.0058

Ethereum price predictions are turning heads, with analysts suggesting ETH could climb to $10,000 by 2026 as institutional demand and network upgrades drive growth. While Ethereum remains a blue-chip asset, investors looking for sharper multiples are eyeing Layer Brett (LBRETT). Currently in presale at just $0.0058, the Ethereum Layer 2 meme coin is drawing huge [...] The post Ethereum Price Prediction: ETH Targets $10,000 In 2026 But Layer Brett Could Reach $1 From $0.0058 appeared first on Blockonomi.
Share
Blockonomi2025/09/17 23:45
Whales Dump 200 Million XRP in Just 2 Weeks – Is XRP’s Price on the Verge of Collapse?

Whales Dump 200 Million XRP in Just 2 Weeks – Is XRP’s Price on the Verge of Collapse?

Whales offload 200 million XRP leaving market uncertainty behind. XRP faces potential collapse as whales drive major price shifts. Is XRP’s future in danger after massive sell-off by whales? XRP’s price has been under intense pressure recently as whales reportedly offloaded a staggering 200 million XRP over the past two weeks. This massive sell-off has raised alarms across the cryptocurrency community, as many wonder if the market is on the brink of collapse or just undergoing a temporary correction. According to crypto analyst Ali (@ali_charts), this surge in whale activity correlates directly with the price fluctuations seen in the past few weeks. XRP experienced a sharp spike in late July and early August, but the price quickly reversed as whales began to sell their holdings in large quantities. The increased volume during this period highlights the intensity of the sell-off, leaving many traders to question the future of XRP’s value. Whales have offloaded around 200 million $XRP in the last two weeks! pic.twitter.com/MiSQPpDwZM — Ali (@ali_charts) September 17, 2025 Also Read: Shiba Inu’s Price Is at a Tipping Point: Will It Break or Crash Soon? Can XRP Recover or Is a Bigger Decline Ahead? As the market absorbs the effects of the whale offload, technical indicators suggest that XRP may be facing a period of consolidation. The Relative Strength Index (RSI), currently sitting at 53.05, signals a neutral market stance, indicating that XRP could move in either direction. This leaves traders uncertain whether the XRP will break above its current resistance levels or continue to fall as more whales sell off their holdings. Source: Tradingview Additionally, the Bollinger Bands, suggest that XRP is nearing the upper limits of its range. This often points to a potential slowdown or pullback in price, further raising concerns about the future direction of the XRP. With the price currently around $3.02, many are questioning whether XRP can regain its footing or if it will continue to decline. The Aftermath of Whale Activity: Is XRP’s Future in Danger? Despite the large sell-off, XRP is not yet showing signs of total collapse. However, the market remains fragile, and the price is likely to remain volatile in the coming days. With whales continuing to influence price movements, many investors are watching closely to see if this trend will reverse or intensify. The coming weeks will be critical for determining whether XRP can stabilize or face further declines. The combination of whale offloading and technical indicators suggest that XRP’s price is at a crossroads. Traders and investors alike are waiting for clear signals to determine if the XRP will bounce back or continue its downward trajectory. Also Read: Metaplanet’s Bold Move: $15M U.S. Subsidiary to Supercharge Bitcoin Strategy The post Whales Dump 200 Million XRP in Just 2 Weeks – Is XRP’s Price on the Verge of Collapse? appeared first on 36Crypto.
Share
Coinstats2025/09/17 23:42
SUI Price Eyes Breakout, Targets $11 Says Analyst

SUI Price Eyes Breakout, Targets $11 Says Analyst

The post SUI Price Eyes Breakout, Targets $11 Says Analyst appeared on BitcoinEthereumNews.com. SUI price shows a technical setup for a macro breakout with analyst Dan Gambardello targeting $10-$11 levels. Recent partnership with Google’s Agentic Payments Protocol adds fundamental support to the technical analysis as SUI moves closer to potential breakout levels. SUI Price Analysis Points to $10-$11 Breakout Target Dan Gambardello has identified a clear ascending triangle formation on SUI price daily chart with upside targets around $10.79. The analyst simplified this target range to $10-$11 for practical trading purposes. The pattern shows sustained higher lows meeting resistance at current levels before a potential breakout. VanEck maintains more aggressive SUI crypto targets ranging from $13-$25 according to Gambardello’s research. SUI Price Analysis | Source: Dan Gambardello, X The $10 level is a more conservative higher high area for the current cycle. Midterm targets point to $7.50 in the 1.618 Fibonacci extension zone before longer-term objectives. The monthly RSI shows extreme compression that Gambardello describes as “screaming for a macro breakout to the upside.” This momentum oscillator behavior typically precedes major price movements in the crypto market. SUI crypto risk model currently sits at 51 and matches pre-bull market levels seen in coins like Ethereum. Gambardello compared this to Ethereum’s December 2020 reading of 51 before its major breakout. The March 2017 Ethereum reading of 53 preceded that cycle’s parabolic move. The analyst also noted that SUI price trades near the same levels from almost a year ago in November 2024. Bollinger Bands Signal Historic Compression CryptoBullet has identified the tightest Bollinger Bands in SUI’s entire trading history on the weekly chart. The BBW indicator compression reached levels that were historically followed by major price movements. This setup mirrors conditions before SUI’s previous major rallies. Historical data shows SUI price delivered +253% gains between December 2023 and March 2024 following similar compression. SUI…
Share
BitcoinEthereumNews2025/09/18 11:32