

Michael Saylor’s Plan: Equity Conversion to Tackle $6B Debt Amid Bitcoin Dip
Key Insights:
- Strategy says its BTC reserves could still cover $6B debt even if price plunges 88% to $8,000.
- Saylor targets a 3–6 year window to convert convertible notes into equity, easing refinance risk.
- BTC now sits on weekly trend support, making follow-through buying crucial for direction.
Bitcoin price prediction remains the center of market debate. Institutional balance sheet strategies overlap with technical trend support.
BTC price has been sliding in recent sessions. It fell from the $90,000 high into the $60,000 range and is now testing a widely followed moving average.
Strategy included a stress scenario to ensure stability. It kept the company afloat even if Bitcoin’s price dropped to $8,000. These advancements contextualize an evaluation of a market that evaluates structural support as well as extreme downside modelling.
Strategy Framework Shapes Bitcoin Price Prediction View
Information circulated by Wu Blockchain detailed the Strategy’s severe downside stress model for its Bitcoin holdings. The company said it could meet all debt obligations even if Bitcoin fell to $8,000.
Its outstanding debt stands at $6 billion. This scenario implies an approximate 88% decline from the reference valuation used in company disclosures.
 Source: X
Importantly, the communication focuses on solvency and coverage rather than forecasting direction. Strategy indicated its Bitcoin reserves significantly exceed net debt under current conditions.
Even in an extreme contraction, the model would match asset value to liabilities. Within Bitcoin price prediction discussions, this highlights institutional balance sheet resilience during volatility.
Additionally, Strategy outlined a plan to convert convertible debt into equity over time. This strategy redefines leverage management by limiting refinancing.
Maturities of the debts are staggered from 2027 to 2032 to accord operating flexibility. The framework indicates a slow shift in the capital model in line with a long-term crypto treasury plan.
Michael Saylor Details Coverage Metrics and Capital Timeline
Meanwhile, the Founder of Strategy, Michael Saylor, reinforced the corporate message by also stating coverage ratios and conversion schedules.
The reserves show strong coverage. The distribution is nearly 8.3 times when compared to net debt. This ratio is based on a reference Bitcoin price of about $69,000.
This ratio implies substantial asset coverage relative to commitments under normal market conditions.
 SOURCE: X
It should be mentioned that the extreme downside model spans nearly 1.0x at a $8,000 Bitcoin price. Even though it is considered to be materially tighter, the framework demonstrates that debt obligations are fully settled.
This modeling provides a framework for Bitcoin price prediction by explaining the institutional exposure between market cycles.
Furthermore, management outlined a three-to-six-year horizon for equitizing convertible debt. This timeline aligns with staggered maturity schedules and capital planning goals.
The company emphasized patience rather than short-term refinancing reliance. The combined message centers on durability within the digital asset capital structure.
Bitcoin Price Prediction Hinges on Trendline Support
According to Rekt Capital analysis, Bitcoin is currently testing a major trendline support on the weekly timeframe.
BTC price previously advanced from the mid-$30,000 zone into a six-figure peak. Throughout that expansion, a rising moving average functioned as dynamic structural support.
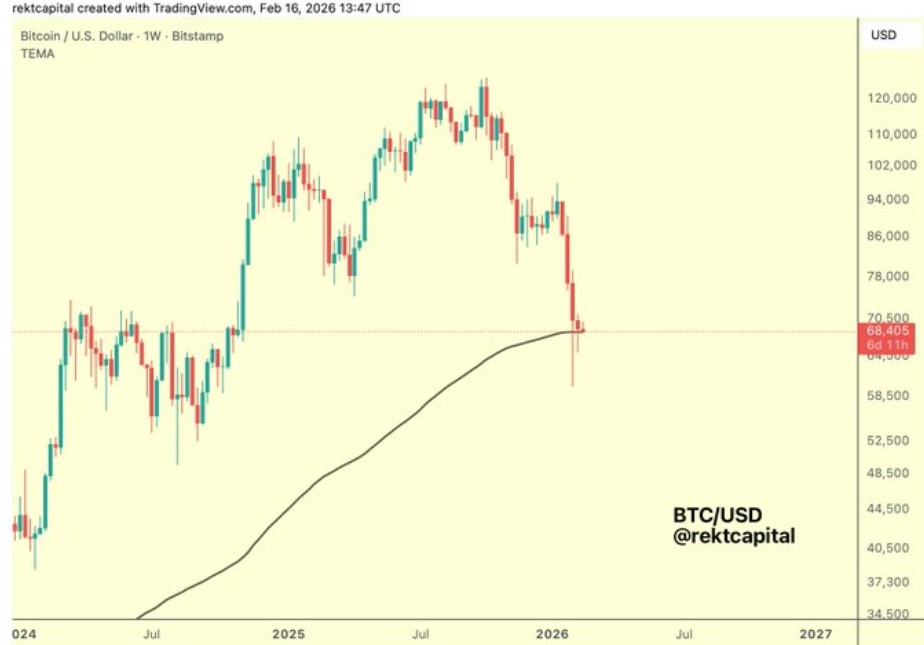 BTCUSD PRICE CHART | Source: X
The recent decline from above $90,000 toward the high-$60,000 zone marks a decisive momentum shift.
Sellers pressed the asset directly into the rising trend gauge after months of controlled pullbacks. The current weekly candle shows a lower wick, indicating initial demand emerging at support.
However, assurance is limited unless there is sustained follow-through buying. Support would have to be validated by bulls rebounding higher than the surrounding horizontal resistance levels.
The absence of stabilization might reveal the previous mid-cycle trading ranges having minimal consolidation. As a result, Bitcoin price prediction now depends heavily on this structural test outcome.
In general, the chart indicates a late stress cycle coming after a prolonged period of expansion. Markets tend to revisit major trend gauges following euphoric moves.
If buyers choose to defend the level or accept lower valuations, this could influence medium-term sentiment. It places the BTC price at a technically sensitive level.
The post Michael Saylor’s Plan: Equity Conversion to Tackle $6B Debt Amid Bitcoin Dip appeared first on The Market Periodical.


You May Also Like

Keeping the human touch

Exclusive interview with Smokey The Bera, co-founder of Berachain: How the innovative PoL public chain solves the liquidity problem and may be launched in a few months


