Silver price is down from its January all-time high of $121. The price looks weak in the near term and could move lower before stability appears. Long-range expectationsSilver price is down from its January all-time high of $121. The price looks weak in the near term and could move lower before stability appears. Long-range expectations

Silver Price to $1,000? These Two Historic Ratios Say It’s Not as Crazy as It Sounds

2026/02/17 17:00
3 min read

Silver price is down from its January all-time high of $121. The price looks weak in the near term and could move lower before stability appears. Long-range expectations still remain strong, and that contrast between short-term pressure and future potential sits at the center of a bold forecast shared by Karel Mercx (@KarelMercx on X).

His thesis does not rely on hype or emotion. The argument rests on two historic ratios that have guided precious metals cycles for more than a century.

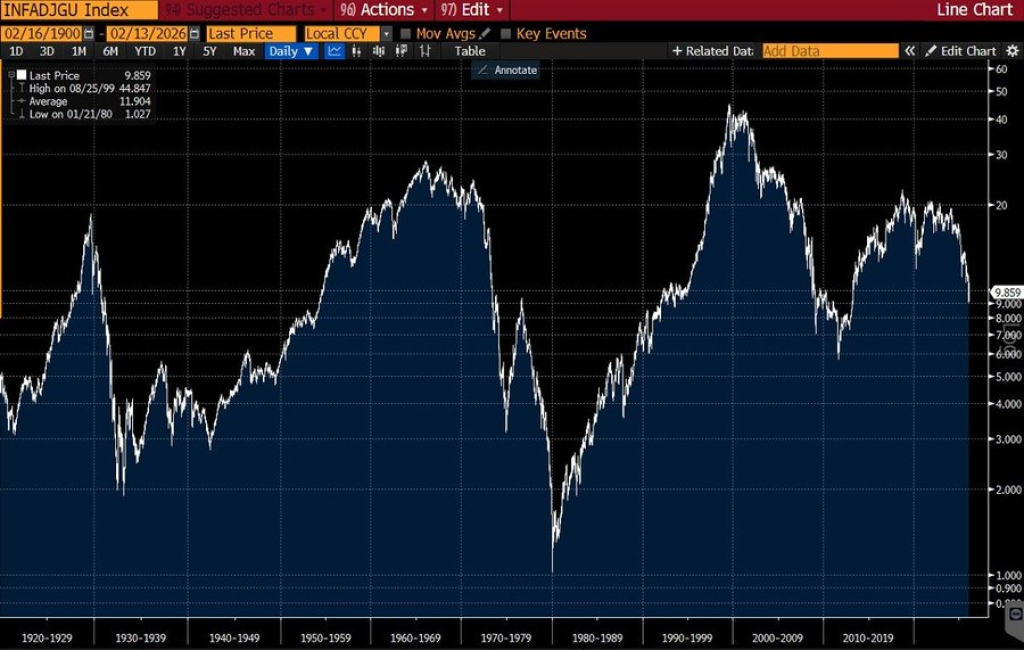
Karel Mercx explains that the Dow priced in gold compresses long periods of market psychology into a single measure. Peaks in optimism appeared in 1929, 1966, and 1999.

@KarelMercx / X

Deep pessimism followed in 1933 and 1980. Present levels now resemble zones that historically preceded another downward move in the ratio, which means gold strengthened against equities during those phases.

Mercx does not accept the idea that the real bottom formed in 2011. Global debt expanded sharply after that year, and past cycles only reached completion once debt pressure eased through either deflation or inflation.

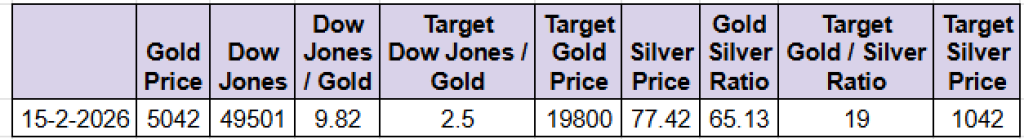
Historical precedent from the 1930s and the 1970s supports that framework. His midpoint target for the Dow-to-gold ratio sits near 2.5. Current readings near 9.82 imply a decline of almost four times if the cycle completes in a similar fashion.

Gold would need to rise toward about $19,800 if the Dow remains close to present territory near 49,501. Mercx notes that equities do not need to collapse for precious metals to reach extreme highs. The 1970s delivered an equity low years before metals peaked, which shows that both trends can unfold on separate timelines.

“Trade Silver on Hyperliquid On-Chain!”

Gold Silver Ratio Compression Creates The Mathematical Path Toward A Four Digit Silver Price

The second pillar of the forecast comes from the gold-silver ratio. Silver trades in a smaller market than gold, which explains why upside phases often move faster once momentum turns positive. The ratio reached 14 at the 1980 extreme. Mercx selects 19 as a conservative midpoint to avoid reliance on perfect timing.

Gold near $19,800 combined with a ratio of 19 produces a silver price slightly above $1,000. Present conditions show gold near $5,042 and silver near $77, which leaves a wide distance between current valuation and historic extremes.

Movement from one extreme to the opposite side of the cycle forms the core logic behind the projection.

@KarelMercx / X

Silver Price Outlook Points To A Possible 2030 To 2033 Window Based On Cycle Structure

Time expectations also draw from the 1970s template described by Karel Mercx. Current Dow to gold positioning resembles the mid-cycle zone seen between 1973 and 1976.

Final metals highs arrived in 1980, which places a similar duration of about four to seven years for the present environment. That framework leads to a projected window between 2030 and 2033 for any move above $1,000.

Read Also: Bittensor Subnets Are the Real Cheat Code – TAO Holders Might Be Missing the Biggest Edge

Short term silver price action may continue to fluctuate, yet the long horizon described by Mercx focuses on structural mathematics instead of daily volatility. Cycles in precious metals often unfold slowly before decisive acceleration appears.

Subscribe to our YouTube channel for daily crypto updates, market insights, and expert analysis.

The post Silver Price to $1,000? These Two Historic Ratios Say It’s Not as Crazy as It Sounds appeared first on CaptainAltcoin.

Market Opportunity
Ucan fix life in1day Logo
Ucan fix life in1day Price(1)
$0.0006288
$0.0006288$0.0006288
-7.16%
USD
Ucan fix life in1day (1) Live Price Chart
Disclaimer: The articles reposted on this site are sourced from public platforms and are provided for informational purposes only. They do not necessarily reflect the views of MEXC. All rights remain with the original authors. If you believe any content infringes on third-party rights, please contact service@support.mexc.com for removal. MEXC makes no guarantees regarding the accuracy, completeness, or timeliness of the content and is not responsible for any actions taken based on the information provided. The content does not constitute financial, legal, or other professional advice, nor should it be considered a recommendation or endorsement by MEXC.

You May Also Like

SEC Clears the Way for Spot Crypto ETFs with New Generic Rules

SEC Clears the Way for Spot Crypto ETFs with New Generic Rules

The post SEC Clears the Way for Spot Crypto ETFs with New Generic Rules appeared first on Coinpedia Fintech News The U.S. SEC has approved new listing standards that simplify the process for launching spot crypto ETFs under the ’33 Act. Cryptocurrencies with listed futures on Coinbase, currently about 12 to 15 coins, will now qualify automatically, removing the need for separate case-by-case approvals. This change streamlines regulatory procedures, cutting delays and hurdles, while opening …
Share
CoinPedia2025/09/18 14:35
Raydium’s 200% volume spike tests RAY’s breakout strength – Here’s why

Raydium’s 200% volume spike tests RAY’s breakout strength – Here’s why

The post Raydium’s 200% volume spike tests RAY’s breakout strength – Here’s why appeared on BitcoinEthereumNews.com. RAY surged over 11% in 24 hours to $0.69 as
Share
BitcoinEthereumNews2026/02/17 18:10
Bitcoin devs cheer block reconstruction stats, ignore security budget concerns

Bitcoin devs cheer block reconstruction stats, ignore security budget concerns

The post Bitcoin devs cheer block reconstruction stats, ignore security budget concerns appeared on BitcoinEthereumNews.com. This morning, Bitcoin Core developers celebrated improved block reconstruction statistics for node operators while conveniently ignoring the reason for these statistics — the downward trend in fees for Bitcoin’s security budget. Reacting with heart emojis and thumbs up to a green chart showing over 80% “successful compact block reconstructions without any requested transactions,” they conveniently omitted red trend lines of the fees that Bitcoin users pay for mining security which powered those green statistics. Block reconstructions occur when a node requests additional information about transactions within a compact block. Although compact blocks allow nodes to quickly relay valid bundles of transactions across the internet, the more frequently that nodes can reconstruct without extra, cumbersome transaction requests from their peers is a positive trend. Because so many nodes switched over in August to relay transactions bidding 0.1 sat/vB across their mempools, nodes now have to request less transaction data to reconstruct blocks containing sub-1 sat/vB transactions. After nodes switched over in August to accept and relay pending transactions bidding less than 1 sat/vB, disparate mempools became harmonized as most nodes had a better view of which transactions would likely join upcoming blocks. As a result, block reconstruction times improved, as nodes needed less information about these sub-1 sat/vB transactions. In July, several miners admitted that user demand for Bitcoin blockspace had persisted at such a low that they were willing to accept transaction fees of just 0.1 satoshi per virtual byte — 90% lower than their prior 1 sat/vB minimum. With so many blocks partially empty, they succumbed to the temptation to accept at least something — even 1 billionth of one bitcoin (BTC) — rather than $0 to fill up some of the excess blockspace. Read more: Bitcoin’s transaction fees have fallen to a multi-year low Green stats for block reconstruction after transaction fees crash After…
Share
BitcoinEthereumNews2025/09/18 04:07