TLDR Solana price fell below $100 on Monday after declining over 15% the previous week Derivatives data shows negative funding rates at -0.0080% with more tradersTLDR Solana price fell below $100 on Monday after declining over 15% the previous week Derivatives data shows negative funding rates at -0.0080% with more traders

Solana (SOL) Price: Why Traders Are Watching the $95 Level After 15% Weekly Decline

TLDR

  • Solana price fell below $100 on Monday after declining over 15% the previous week
  • Derivatives data shows negative funding rates at -0.0080% with more traders betting on price decreases
  • Solana spot ETFs recorded $2.45 million in outflows last week, marking first weekly withdrawals since launch
  • Technical analysis identifies key support levels at $95.26 and potentially $79 if selling continues
  • Price currently trading around $99-$104 range with RSI indicator showing extreme oversold conditions at 25

Solana price dropped below the $100 level on Monday, continuing a correction that saw the cryptocurrency lose more than 15% in the previous week. The move represents a test of a critical support zone that has influenced price action throughout the past year.

Solana (SOL) PriceSolana (SOL) Price

The cryptocurrency was rejected at weekly resistance of $126.65 on Wednesday before beginning its decline. By Sunday, SOL had broken below the $100 psychological level. Current trading shows the price hovering between $99 and $104.

Market sentiment data reveals bearish positioning among traders. The OI-Weighted Funding Rate turned negative on Saturday and currently sits at -0.0080%. This metric indicates that short position holders are paying long position holders, suggesting more traders expect further price declines.

The long-to-short ratio for Solana reads 0.97, below the neutral level of one. This ratio confirms that more market participants are betting on price decreases than increases.

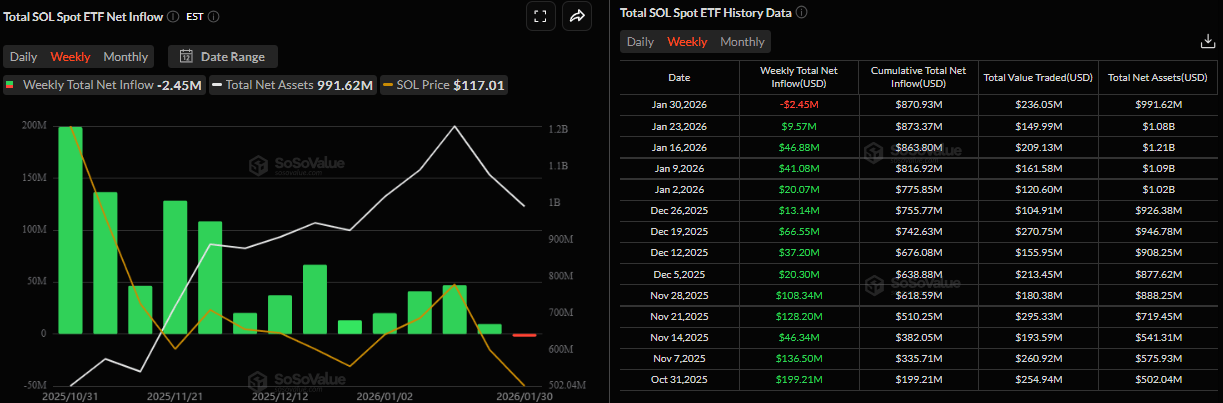
Institutional demand showed weakness last week. Spot Exchange Traded Funds for Solana recorded outflows of $2.45 million. These withdrawals marked the first weekly negative flows since the ETFs launched.

Source: SoSoValue

Despite recent weakness, cumulative net inflows for Solana ETFs remain positive overall. The funds have maintained relatively steady institutional demand even during the current market conditions.

Technical Levels and Indicators

Technical analysis points to several key price levels. A daily close below $100 could trigger further selling toward $95.26, which corresponds to an April 7 low. Breaking that support might push prices down to $79, matching a January 2024 low.

The Relative Strength Index on the daily chart reads 25, indicating extreme oversold conditions. This level typically signals strong selling pressure in the market.

The Moving Average Convergence Divergence indicator showed a bearish crossover on January 19. This signal remains in effect with rising red histogram bars below the neutral level, supporting the current negative outlook.

Support and Resistance Zones

Price charts identify multiple zones of interest. The immediate support range sits between $100 and $105, an area that has acted as a reaction point multiple times over the past year.

If the current support fails, the next levels to watch are $98, followed by $90 to $92. A breakdown below these points would confirm continued selling pressure.

On the recovery side, any bounce would need to reclaim $110 to $115 with strong volume to shift short-term momentum. The weekly resistance at $126.65 remains the first major obstacle for any sustained rally.

The 21-day and 50-day simple moving averages are trending downward on the four-hour chart. The 21-day SMA crossed below the 50-day SMA, a technical signal often associated with further declines.

Solana reached an intraday low of $96 before recovering slightly. The price attempted an upward correction that stalled at $108 before resuming downward movement.

Weekly structure analysis shows Solana interacting with a Fibonacci support cluster between $95 and $100. This zone aligns with prior consolidation periods and has historically preceded multi-month recoveries. However, failure to hold this region could open the path toward $80 to $85.

The cryptocurrency ended a sideways trading pattern that had persisted since November 21, 2025, when prices held above $120 support. That consolidation phase ended with the recent break below $120.

The post Solana (SOL) Price: Why Traders Are Watching the $95 Level After 15% Weekly Decline appeared first on CoinCentral.

Disclaimer: The articles reposted on this site are sourced from public platforms and are provided for informational purposes only. They do not necessarily reflect the views of MEXC. All rights remain with the original authors. If you believe any content infringes on third-party rights, please contact service@support.mexc.com for removal. MEXC makes no guarantees regarding the accuracy, completeness, or timeliness of the content and is not responsible for any actions taken based on the information provided. The content does not constitute financial, legal, or other professional advice, nor should it be considered a recommendation or endorsement by MEXC.

You May Also Like

Justin Sun Bitcoin Move: Strategic $100M Treasury Acquisition Signals Major Confidence

Justin Sun Bitcoin Move: Strategic $100M Treasury Acquisition Signals Major Confidence

BitcoinWorld Justin Sun Bitcoin Move: Strategic $100M Treasury Acquisition Signals Major Confidence In a significant move for cryptocurrency markets, Tron founder
Share
bitcoinworld2026/02/02 19:10
Natera Submits Signatera™ CDx PMA to FDA

Natera Submits Signatera™ CDx PMA to FDA

Application backed by landmark phase 3 data validating MRD-guided treatment in bladder cancer AUSTIN, Texas–(BUSINESS WIRE)–Natera, Inc. (NASDAQ: NTRA), a global
Share
AI Journal2026/02/02 19:15
Ethereum koers toont zeldzaam dubbel koopsignaal en richt zich op $4.550

Ethereum koers toont zeldzaam dubbel koopsignaal en richt zich op $4.550

Connect met Like-minded Crypto Enthusiasts! Connect op Discord! Check onze Discord   Ethereum laat op de uurgrafiek twee opeenvolgende TD Sequential koopsignalen zien. Deze indicator meet uitputting in een trend en geeft vaak een signaal dat de verkoopdruk kan afnemen. Dit dubbele signaal verschijnt rond het niveau van $4.516, waar de ETH prijs kortstondig steun vindt. Dit type formatie komt zelden voor en wordt daarom extra nauwlettend gevolgd. Wat gaat de Ethereum koers hiermee doen? Ethereum koers test steun rond $4.516 De scherpe daling van de Ethereum koers vanaf de prijszone rond $4.800 bracht de ETH prijs in korte tijd naar ongeveer $4.516. Op dit niveau trad duidelijke koopactiviteit op, waardoor de neerwaartse beweging tijdelijk werd gestopt. Het dubbele signaal dat door de TD Sequential indicator is gegenereerd, viel precies samen met dit prijspunt. De TD Sequential is opgebouwd uit negen candles die een trend meetellen. Wanneer de negende candle verschijnt, kan dit duiden op een trendomslag. In dit geval verschenen zelfs twee signalen kort na elkaar, wat aangeeft dat de verkoopdruk mogelijk uitgeput is. Het feit dat dit gebeurde in een zone waar ETH kopers actief bleven, maakt het patroon extra opvallend. TD Sequential just flashed two buy signals for Ethereum $ETH! pic.twitter.com/JPO8EhiEPi — Ali (@ali_charts) September 16, 2025 Welke crypto nu kopen?Lees onze uitgebreide gids en leer welke crypto nu kopen verstandig kan zijn! Welke crypto nu kopen? Fed-voorzitter Jerome Powell heeft aangekondigd dat de rentes binnenkort zomaar eens omlaag zouden kunnen gaan, en tegelijkertijd blijft BlackRock volop crypto kopen, en dus lijkt de markt klaar om te gaan stijgen. Eén vraag komt telkens terug: welke crypto moet je nu kopen? In dit artikel bespreken we de munten die… Continue reading Ethereum koers toont zeldzaam dubbel koopsignaal en richt zich op $4.550 document.addEventListener('DOMContentLoaded', function() { var screenWidth = window.innerWidth; var excerpts = document.querySelectorAll('.lees-ook-description'); excerpts.forEach(function(description) { var excerpt = description.getAttribute('data-description'); var wordLimit = screenWidth wordLimit) { var trimmedDescription = excerpt.split(' ').slice(0, wordLimit).join(' ') + '...'; description.textContent = trimmedDescription; } }); }); Technische indicatoren schetsen herstelkans voor ETH Naast de dubbele koopsignalen verstrekken ook andere indicatoren belangrijke aanwijzingen. Tijdens de daling van de ETH koers waren grote rode candles zichtbaar, maar na de test van $4.516 stabiliseerde de Ethereum koers. Dit wijst op een mogelijke verschuiving in het evenwicht tussen de bears en bulls. Als deze opwaartse beweging doorzet, liggen de eerste weerstanden rond $4.550. Daarboven wacht een sterkere zone rond $4.650. Deze niveaus zijn in eerdere Ethereum sessies al meerdere keren getest. Een doorbraak zou ruimte openen richting de all-time high van ETH rond $4.953. Wanneer de prijs toch opnieuw onder $4.516 zakt, liggen er zones rond $4.500 en $4.450 waar grotere kooporders worden verwacht. Deze niveaus kunnen als een vangnet fungeren, mocht de druk opnieuw toenemen. Marktdynamiek bevestigt technische indicatoren De huidige situatie volgt op een bredere correctie in de cryptomarkt. Verschillende vooraanstaande crypto tokens zagen scherpe koersdalingen, waarna traders op zoek gingen naar signalen voor een mogelijke ommekeer. Dat juist Ethereum nu een dubbel TD Sequential signaal toont, versterkt de interesse in dit scenario. Fundamenteel blijft Ethereum sterk. Het aantal ETH tokens dat via staking is vastgezet, blijft groeien. Dat verkleint de vrije circulatie en vermindert verkoopdruk. Tegelijk blijft het netwerk intensief gebruikt voor DeFi, NFT’s en stablecoins. Deze activiteiten zorgen voor een stabiele vraag naar ETH, ook wanneer de prijs tijdelijk onder druk staat. Fundamentele drijfveren achter de Ethereum koers De Ethereum koers wordt echter niet alleen bepaald door candles en patronen, maar ook door bredere factoren. Een stijgend percentage van de totale ETH supply staat vast in staking contracten. Hierdoor neemt de liquiditeit op exchanges af. Dit kan prijsschommelingen versterken wanneer er plotseling meer koopdruk ontstaat. Daarnaast is Ethereum nog steeds het grootste smart contract platform. Nieuwe standaarden zoals ERC-8004 en ontwikkelingen rond layer-2 oplossingen houden de activiteit hoog. Deze technologische vooruitgang kan de waardepropositie ondersteunen en zo indirect bijdragen aan een ETH prijsherstel. Het belang van de korte termijn dynamiek De komende handelsdagen zullen duidelijk maken of de bulls genoeg kracht hebben om door de weerstandszone rond $4.550 te breken. Voor de bears ligt de focus juist op het verdedigen van de prijsregio rond $4.516. De whales, die met grote handelsorders opereren, kunnen hierin een beslissende rol spelen. Het dubbele TD Sequential signaal blijft hoe dan ook een zeldzame gebeurtenis. Voor cryptoanalisten vormt het een objectief aanknopingspunt om de kracht van de huidige Ethereum trend te toetsen. Vooruitblik op de ETH koers Ethereum liet twee opeenvolgende TD Sequential signalen zien op de uurgrafiek, iets wat zelden voorkomt. Deze formatie viel samen met steun rond $4.516, waar de bulls actief werden. Als de Ethereum koers boven dit niveau blijft, kan er ruimte ontstaan richting $4.550 en mogelijk $4.650. Zakt de prijs toch opnieuw onder $4.516, dan komen $4.500 en $4.450 in beeld als nieuwe steunzones. De combinatie van zeldzame indicatoren en een sterke fundamentele basis maakt Ethereum interessant voor zowel technische als fundamentele analyses. Of de bulls het momentum echt kunnen overnemen, zal blijken zodra de Ethereum koers de eerstvolgende weerstanden opnieuw test. Koop je crypto via Best Wallet Best wallet is een topklasse crypto wallet waarmee je anoniem crypto kan kopen. Met meer dan 60 chains gesupport kan je al je main crypto coins aanschaffen via Best Wallet. Best wallet - betrouwbare en anonieme wallet Best wallet - betrouwbare en anonieme wallet Meer dan 60 chains beschikbaar voor alle crypto Vroege toegang tot nieuwe projecten Hoge staking belongingen Lage transactiekosten Best wallet review Koop nu via Best Wallet Let op: cryptocurrency is een zeer volatiele en ongereguleerde investering. Doe je eigen onderzoek. Het bericht Ethereum koers toont zeldzaam dubbel koopsignaal en richt zich op $4.550 is geschreven door Dirk van Haaster en verscheen als eerst op Bitcoinmagazine.nl.
Share
Coinstats2025/09/17 23:31