TLDR Solana (SOL) is trading 19% below its all-time high of $294, with technical analysis targeting $300-$400 Corporate demand is growing with Forward Industries holding the largest SOL stash and establishing a $4 billion buying program SOL broke out of an ascending channel pattern and is testing key resistance at $243-$262 Fibonacci extension levels suggest [...] The post Solana (SOL) Price: Corporate Giants Stack Tokens as New All-Time High Approaches appeared first on CoinCentral.TLDR Solana (SOL) is trading 19% below its all-time high of $294, with technical analysis targeting $300-$400 Corporate demand is growing with Forward Industries holding the largest SOL stash and establishing a $4 billion buying program SOL broke out of an ascending channel pattern and is testing key resistance at $243-$262 Fibonacci extension levels suggest [...] The post Solana (SOL) Price: Corporate Giants Stack Tokens as New All-Time High Approaches appeared first on CoinCentral.

Solana (SOL) Price: Corporate Giants Stack Tokens as New All-Time High Approaches

2025/09/21 18:43
3 min read

TLDR

  • Solana (SOL) is trading 19% below its all-time high of $294, with technical analysis targeting $300-$400
  • Corporate demand is growing with Forward Industries holding the largest SOL stash and establishing a $4 billion buying program
  • SOL broke out of an ascending channel pattern and is testing key resistance at $243-$262
  • Fibonacci extension levels suggest potential targets of $363 and $473 if price discovery begins
  • Social dominance has reached 11% while institutional backing includes new ETF listings and corporate treasury adoption

Solana has recovered strongly in September, positioning the altcoin within reach of its record high. The cryptocurrency is trading just 19% below its all-time high of $294 at current levels.
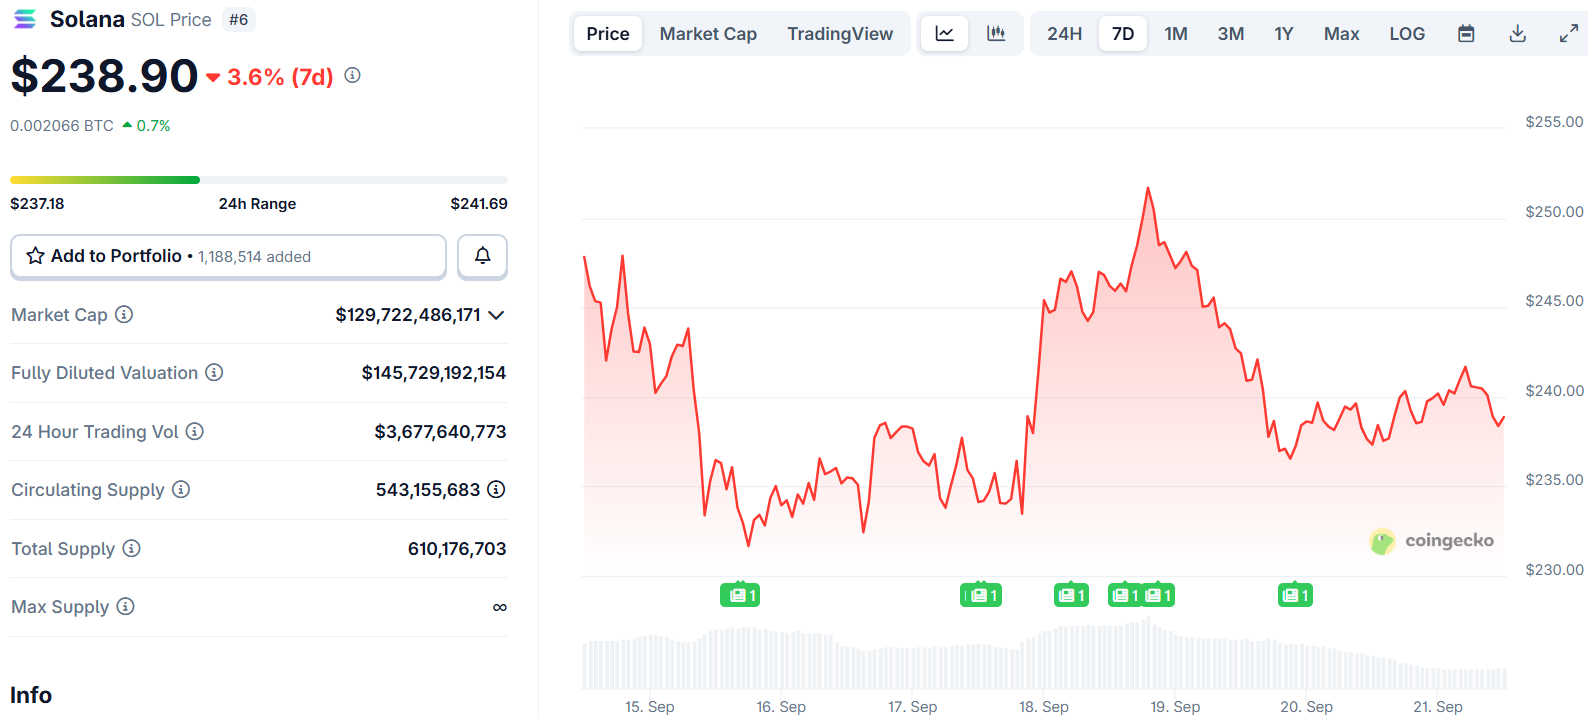
Solana (SOL) PriceSolana (SOL) Price

Technical analysis shows SOL has broken out of an ascending channel pattern on the daily chart. Bulls are now testing a key resistance band near $243, which aligns with recent swing highs and rejection wicks.

The altcoin is trading above its 20, 50, and 200-day exponential moving averages. The 20-day EMA has provided dynamic support for nearly a month, cushioning pullbacks during the recent rally.

A daily close above $243 could trigger a volatile move toward the mid-$240s and the psychological $250 level. This resistance area has relatively low historical trading volumes, which could amplify price movements.

Solana 1-week ChartSource: TradingView

SOL’s momentum has cooled in the near term. The daily Relative Strength Index dropped from overbought territory to around 61. The MACD indicator is trending lower and threatening a bearish crossover.

If bulls defend the 20-EMA around $226, the path to a $250 retest remains open. Technical analysts have identified a rounded bottom pattern formed earlier this year, supporting the $300 target.

Corporate Treasury Adoption Accelerates

Forward Industries now holds the largest stash of SOL among public companies. The firm has established a $4 billion at-the-market program to continue adding to its holdings.

This corporate mandate could translate into steady demand over time. Brera Holdings recently rebranded to “Solmate” alongside a $300 million investment round led by UAE-based Pulsar Group.

The investment round included participation from ARK Invest and the Solana Foundation. The announcement initially sent Brera’s shares higher before volatility set in.

Treasury company reserves have seen steady accumulation of SOL tokens. This corporate adoption trend provides fundamental support for long-term price appreciation.

Grayscale’s CoinDesk Crypto 5 ETF has begun trading on NYSE Arca. The fund offers regulated exposure to five top digital assets, including Solana with a single-digit weighting.

Price Discovery Targets Emerge

Fibonacci extension levels indicate potential targets of $363 and $473 if SOL enters price discovery mode. The rounded bottom formation suggests these levels are achievable in the coming months.

After bottoming at $8, the two-year rally included periods of slow consolidation and explosive upward movement. SOL reached $295 in late 2024 before retracing to $95.2 in April.

The April drop fell just below the 61.8% retracement level at $117.95. Since breaking above this key Fibonacci level, Solana has rallied consistently higher.

In an extreme scenario where Bitcoin reaches $150,000-$160,000, SOL could potentially reach $583. This target depends on continued capital rotation from Ethereum into Solana.

Social dominance data shows Solana commanding 11% of Web3 conversations. This represents more than one in ten crypto discussions mentioning SOL.

The altcoin’s high daily token volume and outperforming Ethereum could drive continued gains into Q4 2025. Spot flows have shown strong outflows while taker CVD moved to neutral from seller-dominant territory.

The post Solana (SOL) Price: Corporate Giants Stack Tokens as New All-Time High Approaches appeared first on CoinCentral.

Market Opportunity
Solana Logo
Solana Price(SOL)
$85.31
$85.31$85.31
+1.80%
USD
Solana (SOL) Live Price Chart
Disclaimer: The articles reposted on this site are sourced from public platforms and are provided for informational purposes only. They do not necessarily reflect the views of MEXC. All rights remain with the original authors. If you believe any content infringes on third-party rights, please contact service@support.mexc.com for removal. MEXC makes no guarantees regarding the accuracy, completeness, or timeliness of the content and is not responsible for any actions taken based on the information provided. The content does not constitute financial, legal, or other professional advice, nor should it be considered a recommendation or endorsement by MEXC.

You May Also Like

New Zealand RBNZ Interest Rate Decision in line with expectations (2.25%)

New Zealand RBNZ Interest Rate Decision in line with expectations (2.25%)

The post New Zealand RBNZ Interest Rate Decision in line with expectations (2.25%) appeared on BitcoinEthereumNews.com. Gold is attempting a bounce from the $4,
Share
BitcoinEthereumNews2026/02/18 09:53
Mississippi holds hearing on xAI data center amid environmental lawsuit threat

Mississippi holds hearing on xAI data center amid environmental lawsuit threat

The Southern Environmental Law Center claims that a planned gas-fired power plant set to power xAI's Colossus II data center will be the largest new source of pollution
Share
Rappler2026/02/18 10:37
Cryptos Signal Divergence Ahead of Fed Rate Decision

Cryptos Signal Divergence Ahead of Fed Rate Decision

The post Cryptos Signal Divergence Ahead of Fed Rate Decision appeared on BitcoinEthereumNews.com. Crypto assets send conflicting signals ahead of the Federal Reserve’s September rate decision. On-chain data reveals a clear decrease in Bitcoin and Ethereum flowing into centralized exchanges, but a sharp increase in altcoin inflows. The findings come from a Tuesday report by CryptoQuant, an on-chain data platform. The firm’s data shows a stark divergence in coin volume, which has been observed in movements onto centralized exchanges over the past few weeks. Bitcoin and Ethereum Inflows Drop to Multi-Month Lows Sponsored Sponsored Bitcoin has seen a dramatic drop in exchange inflows, with the 7-day moving average plummeting to 25,000 BTC, its lowest level in over a year. The average deposit per transaction has fallen to 0.57 BTC as of September. This suggests that smaller retail investors, rather than large-scale whales, are responsible for the recent cash-outs. Ethereum is showing a similar trend, with its daily exchange inflows decreasing to a two-month low. CryptoQuant reported that the 7-day moving average for ETH deposits on exchanges is around 783,000 ETH, the lowest in two months. Other Altcoins See Renewed Selling Pressure In contrast, other altcoin deposit activity on exchanges has surged. The number of altcoin deposit transactions on centralized exchanges was quite steady in May and June of this year, maintaining a 7-day moving average of about 20,000 to 30,000. Recently, however, that figure has jumped to 55,000 transactions. Altcoins: Exchange Inflow Transaction Count. Source: CryptoQuant CryptoQuant projects that altcoins, given their increased inflow activity, could face relatively higher selling pressure compared to BTC and ETH. Meanwhile, the balance of stablecoins on exchanges—a key indicator of potential buying pressure—has increased significantly. The report notes that the exchange USDT balance, around $273 million in April, grew to $379 million by August 31, marking a new yearly high. CryptoQuant interprets this surge as a reflection of…
Share
BitcoinEthereumNews2025/09/18 01:01