XRP Price Slides Under Support, Bearish Continuation Signals Emerge
XRP price failed to surpass $1.950 and started another decline. The price is now correcting gains and might struggle to stay above $1.850.
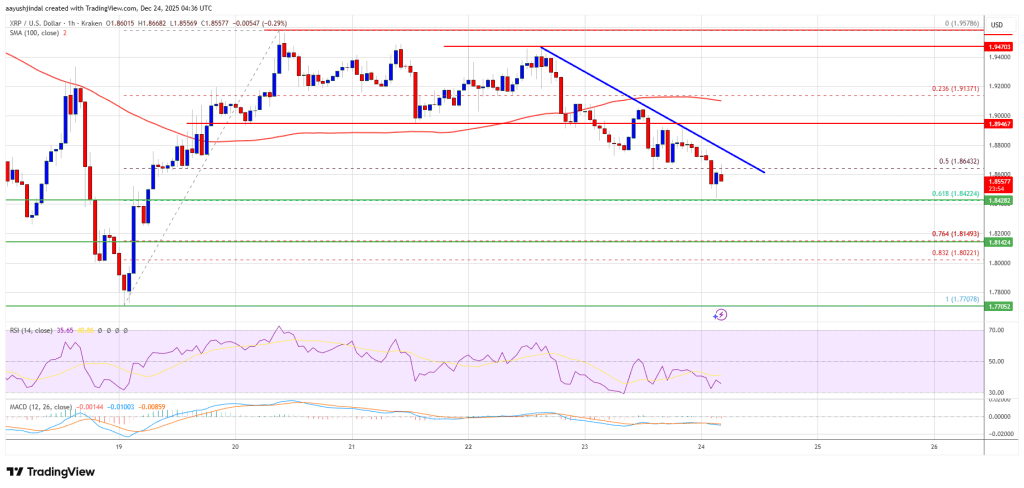
- XRP price started a downside correction and tested the $1.850 zone.
- The price is now trading below $1.880 and the 100-hourly Simple Moving Average.
- There is a new bearish trend line forming with resistance at $1.870 on the hourly chart of the XRP/USD pair (data source from Kraken).
- The pair could start another increase if it clears $1.90.
XRP Price Starts Fresh Decline
XRP price started a downside correction below the $1.9350 zone, like Bitcoin and Ethereum. The price dipped below the $1.90 and $1.880 levels to enter a negative zone.
The price even dipped below the 50% Fib retracement level of the upward move from the $1.770 swing low to the $1.9578 high. Besides, there is a new bearish trend line forming with resistance at $1.870 on the hourly chart of the XRP/USD pair.
The price is now trading below $1.880 and the 100-hourly Simple Moving Average. If there is a fresh upward move, the price might face resistance near the $1.870 level and the trend line. The first major resistance is near the $1.880 level, above which the price could rise and test $1.90.
A clear move above the $1.90 resistance might send the price toward the $1.950 resistance. Any more gains might send the price toward the $2.00 resistance. The next major hurdle for the bulls might be near $2.050.
More Losses?
If XRP fails to clear the $1.90 resistance zone, it could start a fresh decline. Initial support on the downside is near the $1.8420 level and the 61.8% Fib retracement level of the upward move from the $1.770 swing low to the $1.9578 high. The next major support is near the $1.80 level.
If there is a downside break and a close below the $1.80 level, the price might continue to decline toward $1.770. The next major support sits near the $1.750 zone, below which the price could continue lower toward $1.720.
Technical Indicators
Hourly MACD – The MACD for XRP/USD is now gaining pace in the bearish zone.
Hourly RSI (Relative Strength Index) – The RSI for XRP/USD is now below the 50 level.
Major Support Levels – $1.8420 and $1.80.
Major Resistance Levels – $1.880 and $1.920.
Potrebbe anche piacerti

White House Publishes Trump’s New Strategy Against Cybercrimes

ArtGis Finance Partners with MetaXR to Expand its DeFi Offerings in the Metaverse