HBAR price forms a risky pattern as ETF inflows stagnate

HBAR price remained in a narrow range above a key support level as exchange-traded funds’ inflows dried.
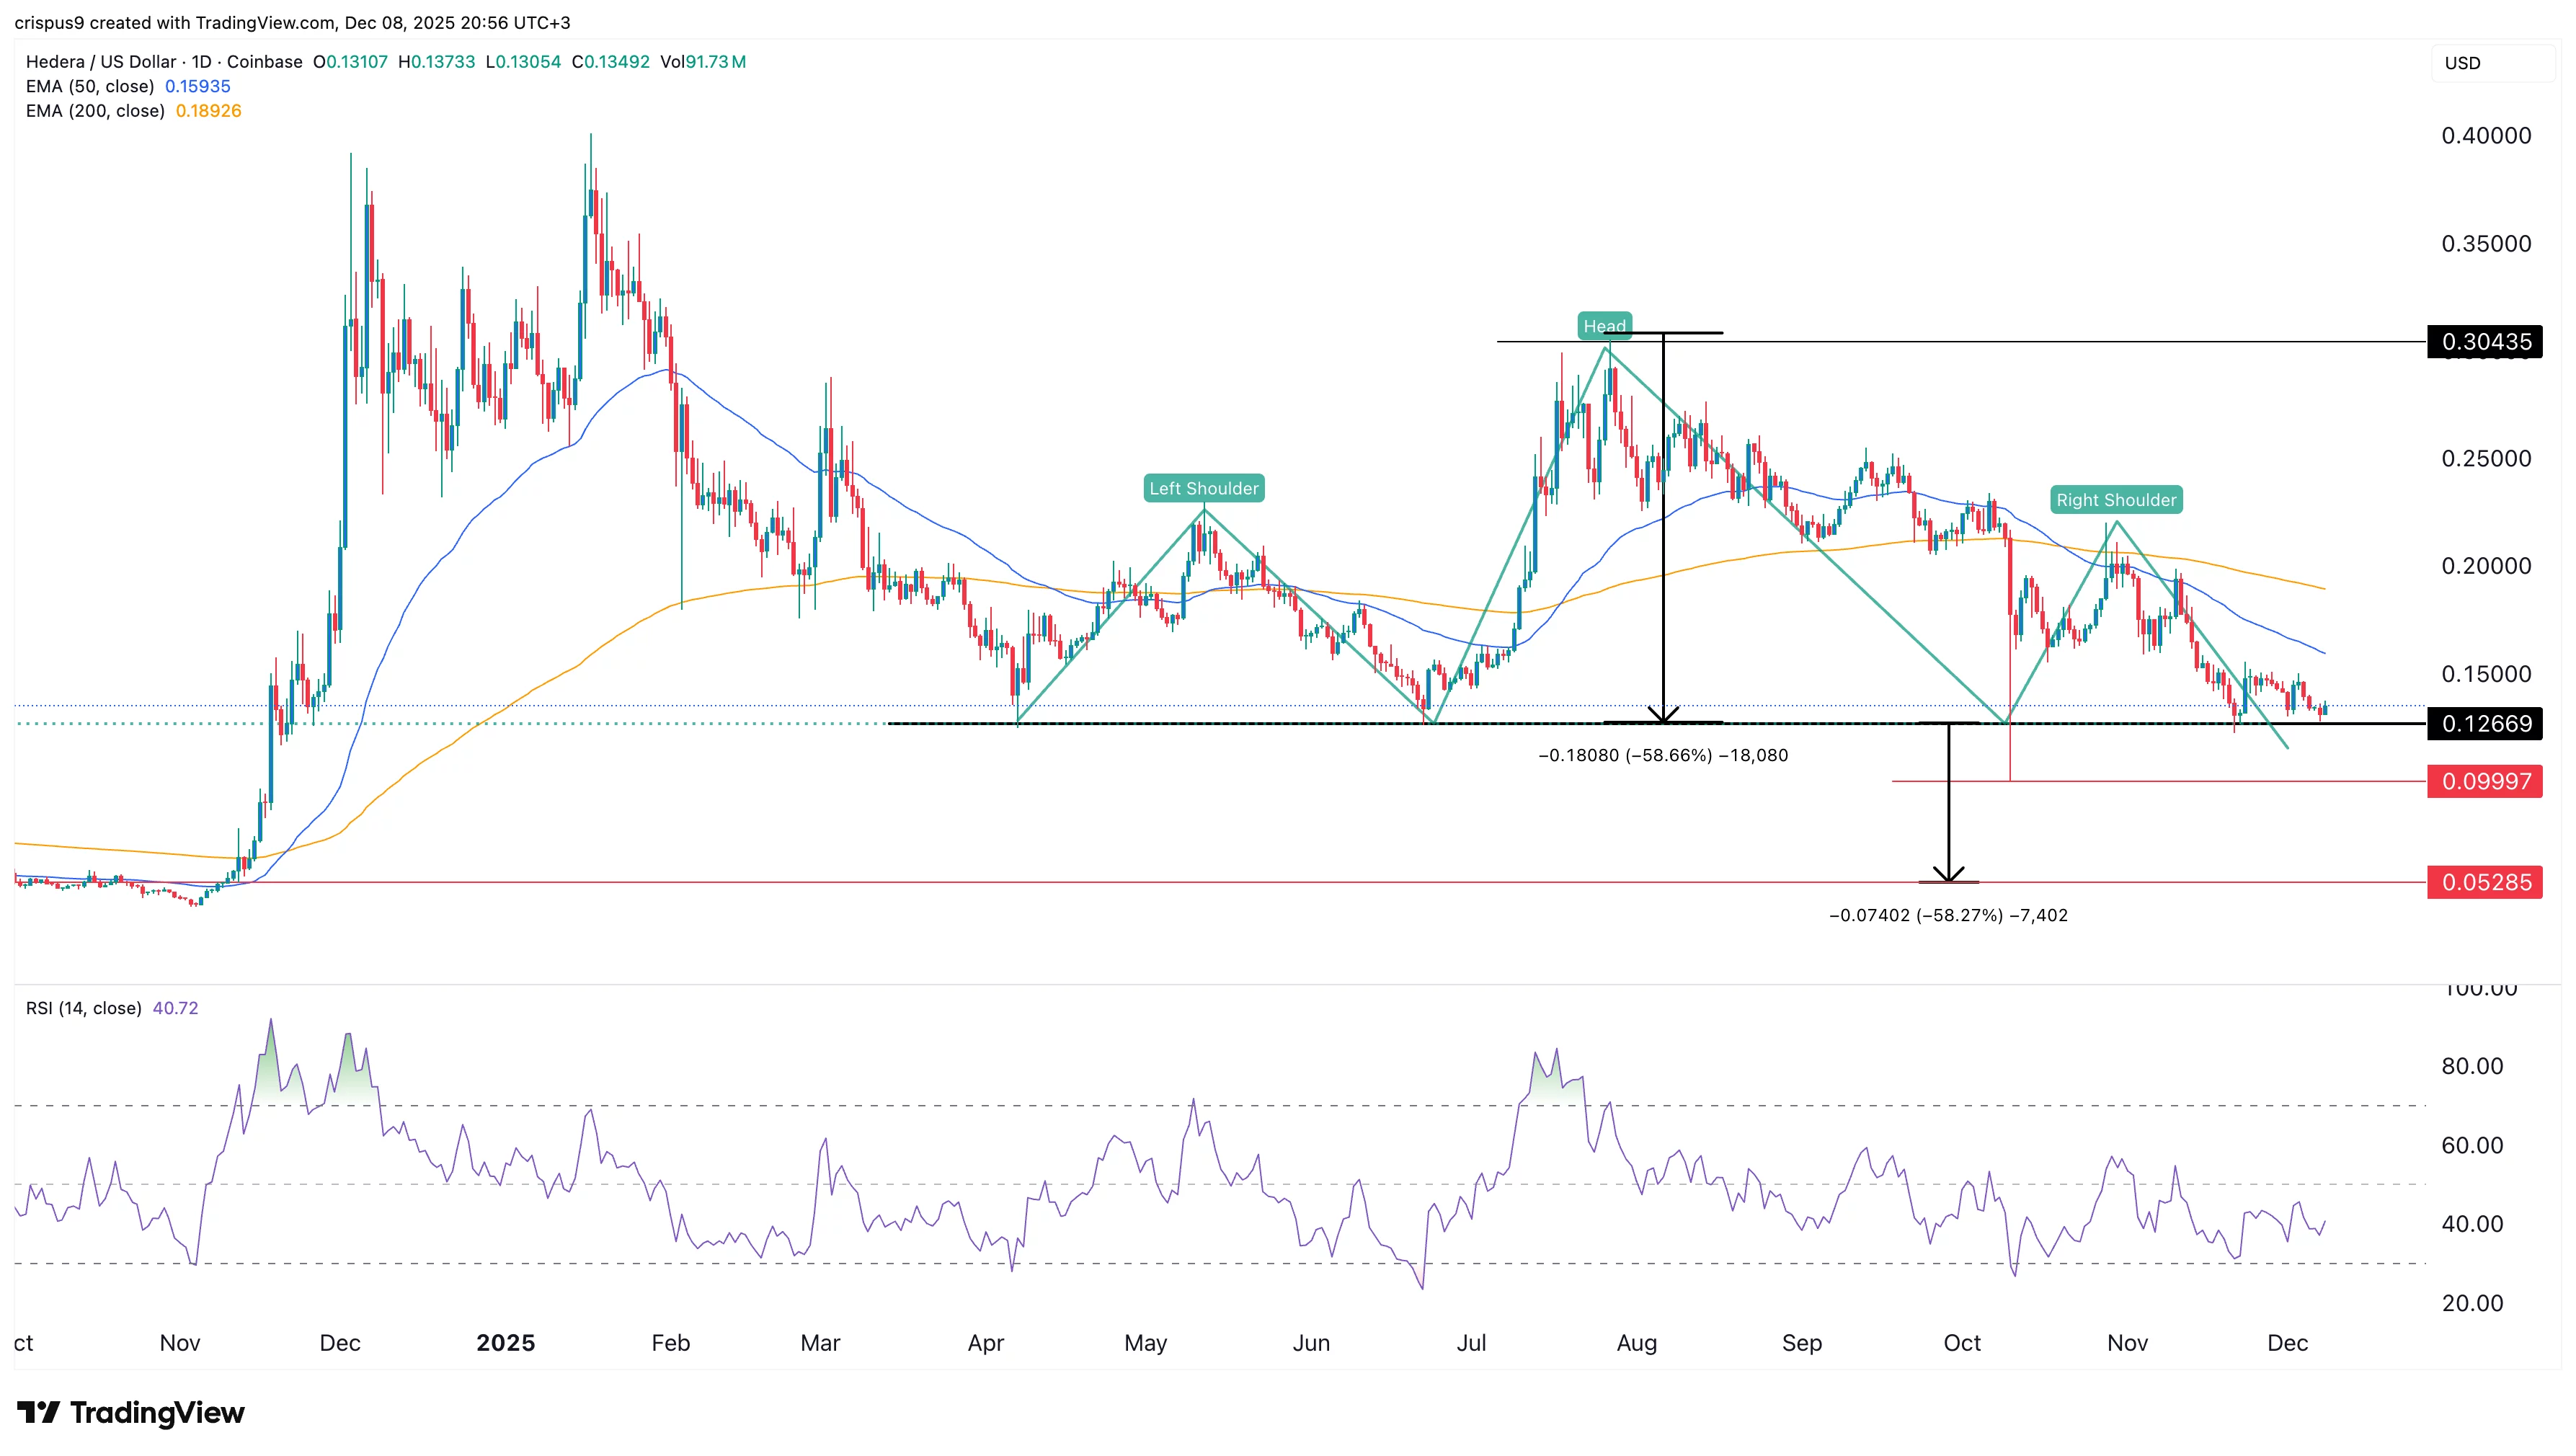
- HBAR price has formed a head-and-shoulders pattern on the daily chart.
- It has also formed a death cross pattern as the 50-day and 200-day moving averages crossed each other.
- Demand for the recently launched HBAR ETFs has dried in the past few days.
Hedera (HBAR) token was trading at $0.1350, down by 55% from its highest point in August.
Data compiled by SoSoValue shows that the cumulative total inflows in Hedera ETFs stood at $82 million, bringing the total net assets to over $61 million, which is equivalent to 1.08% of its market capitalization.
The pace of growth has slowed in the past few days, possibly as investors focused on other tokens like Solana (SOL), Ripple (XRP), and Chainlink (LINK).
The Canary HBAR ETF did not have inflows on Thursday and Friday last week. Its weekly inflows stood at just $1.78 million, down from the previous week’s $4.2 million. Its best performance was shortly after launch when it attracted $70 million in inflows in the first two weeks.
Demand for the spot Hedera ETF has likely slowed because of its slow ecosystem growth. Data compiled by DeFi Llama shows that Hedera has not attracted any new dApp in the DeFi industry in for past few months.
Its total value locked dropped by 20% in the last 30 days to $142 million, while the stablecoin supply has dropped from over $170 million in November to $83 million.
HBAR price technical analysis
Technicals suggest that the Hedera price is at risk of a deeper dive in the coming weeks.
It has formed the highly bearish head-and-shoulders pattern, whose head is at $0.3043, while the right and left shoulders are at $0.2260.
HBAR price is now sitting near the neckline at $0.1266, its lowest level in April, June, and November this year. The distance between the head and the neckline is ~58%, and measuring the same distance from the neckline points to a drop to $0.052.
Technical indicators point to more downside in the coming weeks. For example, the 50-day and 200-day Exponential Moving Averages made a death cross on Oct. 19.
The token has moved below the Supertrend indicator, a sign that bears remain in control. Also, the Relative Strength Index has continued to fall over the past few months, a sign it has lost momentum.


Potrebbe anche piacerti

Pay USDT and we’ll carry out ‘any form of revenge you like,’ say South Korean criminals

Crafting a resume that cuts through the “blackhole” of AI filtering systems