

Ethereum Classic Price Drops 9% as Funding Turns Deeply Negative
This article was first published on The Bit Journal.
Ethereum Classic price has fallen nearly 9% in just one day, but the real shift is happening behind the scenes. Traders are not just reacting to a red candle. They are watching liquidity, funding rates, and structural pressure build at once.
According to the source, nearly 9% of liquidity exited the perpetual futures market, pushing open interest down to about $90.12 million. That contraction matters because it shows who remains active. In this case, remaining capital appears concentrated in short positions. The Ethereum Classic price decline reflects more than panic. It reflects positioning.
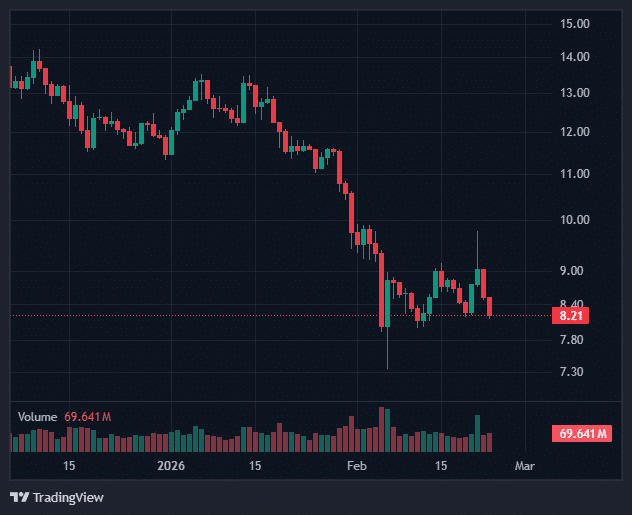
Verified market data shows Ethereum Classic price trading near the $9 region after the slide, while daily volume adjusted lower. The ETC price has entered a pressure zone that now demands close attention.
 Source: Coinmarketcap
Capital Concentration Explains Why Ethereum Classic Price Is Under Pressure
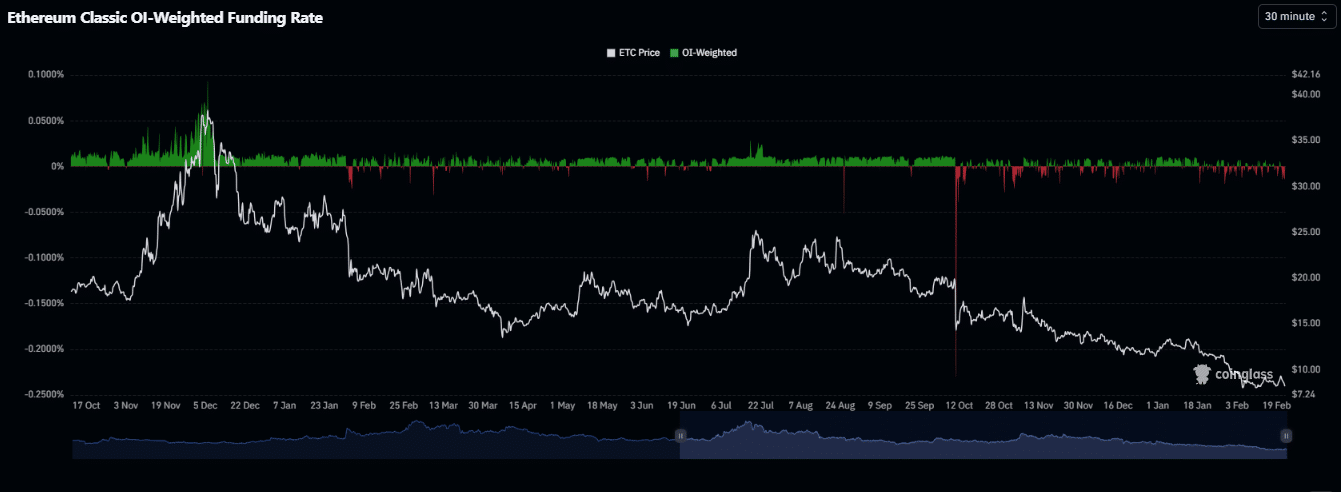
The core story is capital concentration. When open interest falls yet funding turns sharply negative, the remaining traders are often heavily skewed in one direction. The Open Interest weighted funding rate printed -0.0282, one of its most negative readings since October 2025. That earlier period also aligned with a similar downturn in Ethereum Classic price.
A negative funding rate means short sellers pay long traders to hold positions. When that rate deepens to -0.0282, it shows conviction. It suggests that the bulk of leveraged capital expects further downside. As highlighted by live derivatives metrics, funding extremes often align with dominant trader bias.
Liquidation data reinforces the imbalance. Long positions absorbed most forced closures during the decline, while short sellers remained relatively insulated. That asymmetry strengthens the bearish thesis. In leveraged markets, conviction often dictates direction more than headlines.
 Source: Coingalss
Structural Confluence Puts ETC Price at a Critical Zone
On the daily chart, Ethereum Classic price trades within a descending channel. Lower highs and diagonal resistance continue to cap rallies. The ETC price currently sits near the midpoint of this structure.
The $9.94 level stands out as a decisive resistance zone. A sustained move above that mark could weaken the bearish structure and invite short covering. Without that breakout, downside pressure likely persists.
The monthly chart adds further caution. Ethereum Classic price has formed a consolidation pattern defined by horizontal support and descending resistance. These formations often resolve near a confluence, where multiple technical forces intersect. In this case, price has already slipped below a key support band.
If the lower structural zone fails, Ethereum Classic price could print a new all time low on the Binance monthly chart. That exchange-specific context raises the stakes for long term holders.
Mixed Signals: Bearish Derivatives but Improving Momentum
Despite bearish derivatives positioning, short-term indicators hint at potential relief. The MACD line trends upward toward a crossover, while histogram bars show growing green momentum. The Aroon indicator also shows Aroon Up above Aroon Down, suggesting rising buying pressure.
Still, momentum does not erase structure. ETC price must reclaim $9.94 to shift bias meaningfully. Until that happens, Ethereum Classic price remains within a broader bearish framework.
This contrast defines the present environment. Derivatives data leans bearish. Technical momentum attempts stabilization. The market now balances between structural weakness and short term hope.
Conclusion
Ethereum Classic price reflects more than a 9% daily loss. Liquidity contraction, an OI weighted funding rate of -0.0282, and long liquidation dominance show capital concentration clearly favors bears. The historical comparison to October 2025 strengthens that signal.
At the same time, improving short term momentum offers a narrow path toward stabilization. The ETC price now stands at a structural crossroads defined by descending resistance and confluence support risk. Traders who monitor funding behavior alongside price structure may gain clearer insight into what comes next. In volatile markets, conviction often moves faster than sentiment.
This article is for informational purposes only and does not constitute financial advice. Readers should conduct their own research before making investment decisions.
Glossary of Key Terms
Open Interest: Total number of active futures contracts in the market.
OI Weighted Funding Rate: Funding adjusted by position size to show capital distribution.
Liquidation: Forced closing of leveraged positions when margin requirements fail.
Descending Channel: Chart pattern defined by falling highs and lows.
Confluence: Area where multiple technical levels intersect.
FAQs Ethereum Classic Price
Why did Ethereum Classic price drop 9%?
Liquidity exited futures markets, funding turned sharply negative, and long positions faced heavy liquidations.
What does a -0.0282 funding rate mean?
It shows strong short positioning and reflects conviction among bearish traders.
Why is $9.94 important for ETC price?
It marks a key resistance level within the descending channel that could shift short term bias.
Could Ethereum Classic price rebound?
A rebound is possible if momentum builds and price reclaims critical resistance.
Sources/References
Coinmarketcap
Coinglass
Read More: Ethereum Classic Price Drops 9% as Funding Turns Deeply Negative">Ethereum Classic Price Drops 9% as Funding Turns Deeply Negative
Ayrıca Şunları da Beğenebilirsiniz

Tokyo’s Metaplanet Launches Miami Subsidiary to Amplify Bitcoin Income

New 15% global tariff reshapes landscape – Commerzbank
