
Bearish Candlestick Patterns
1. Hanging Man Pattern
2. Shooting Star Pattern
3. Bearish Engulfing Pattern
4. Evening Star Pattern
5. Three Black Crows Pattern
Popular Articles

What is Solana Mobile (SKR)?A Blockchain-Native Smartphone Platform Bridging Hardware, dApps, and Tokenized Governance
Key Takeaways1)Solana Mobile is a hardware-first Web3 platform, integrating self-custody and blockchain security directly into smartphones.2)Saga and Seeker phones function as on-chain access devices,

What is Immunefi(IMU)? A Complete Guide to Web3's Leading Security Platform
Key Takeaways1) Immunefi focuses on continuous Web3 security coordination, not one-time audits.2) Bug bounties and audit competitions form the core of its security model.3) Magnus serves as an operati
What Is VOOI ($VOOI)? A Non-Custodial Perpetual DEX Aggregator Explained
Key Takeaways1)VOOI is a non-custodial perpetual DEX aggregator that routes trades across multiple DEXs without holding user funds.2)The platform leverages chain abstraction and intent-based execution

Balancing Security and Accuracy: Dynamic Logic of Risk Control Systems
As crypto markets evolve, so do the tactics used by fraudsters and market manipulators. To keep users safe and preserve market integrity, crypto exchanges must constantly enhance their risk control an
Hot Crypto Updates

hadtotakeprofits sir (HTTPS) Spot Trading Platform Comparison: Why MEXC Leads the Market
Choosing the right hadtotakeprofits sir (HTTPS) spot trading platform can significantly impact your trading success. MEXC stands out among cryptocurrency exchanges with superior features, competitive

Hadtotakeprofits sir (HTTPS) MEXC Spot Trading App: Your Gateway to Mobile Trading
The MEXC spot trading app revolutionizes how you trade hadtotakeprofits sir (HTTPS) with industry-leading zero maker fees and access to over 3,000 trading pairs. As one of the world's most trusted cry

hadtotakeprofits sir (HTTPS) Spot Trading Strategies: A Beginner's Guide
Spot trading involves buying and selling cryptocurrencies for immediate delivery at current market prices. For beginners looking to trade hadtotakeprofits sir (HTTPS), understanding effective spot tra

hadtotakeprofits sir (HTTPS) MEXC Spot Trading Fee: Complete Guide for Beginners
Understanding MEXC spot trading fees is crucial when trading hadtotakeprofits sir (HTTPS). MEXC operates on a maker–taker fee structure with 0% fees for makers and 0.05% fees for takers on spot market
Trending News

Whales keep selling XRP despite ETF success — Data signals deeper weakness
The post Whales keep selling XRP despite ETF success — Data signals deeper weakness appeared on BitcoinEthereumNews.com. XRP ETFs have crossed $1 billion in assets

Foreigner’s Lou Gramm Revisits The Band’s Classic ‘4’ Album, Now Reissued
The post Foreigner’s Lou Gramm Revisits The Band’s Classic ‘4’ Album, Now Reissued appeared on BitcoinEthereumNews.com. American-based rock band Foreigner performs onstage at the Rosemont Horizon, Ros

New York Regulators Push Banks to Adopt Blockchain Analytics
New York’s top financial regulator urged banks to adopt blockchain analytics, signaling tighter oversight of crypto-linked risks. The move reflects regulators’ concern that traditional institutions fa
Hedera Price Analysis Shows Persistent Bearish Pressure Near $0.112
Hedera continues to be on the wrong side of the market with price having trouble stabilizing below major resistance zones with deteriorating momentum and participation
Related Articles

How to Use TradingView on MEXC
TradingView is a powerful trading analysis tool that caters to users of all experience levels. MEXC has integrated TradingView's charting tools, allowing you to use them directly on the MEXC platform.
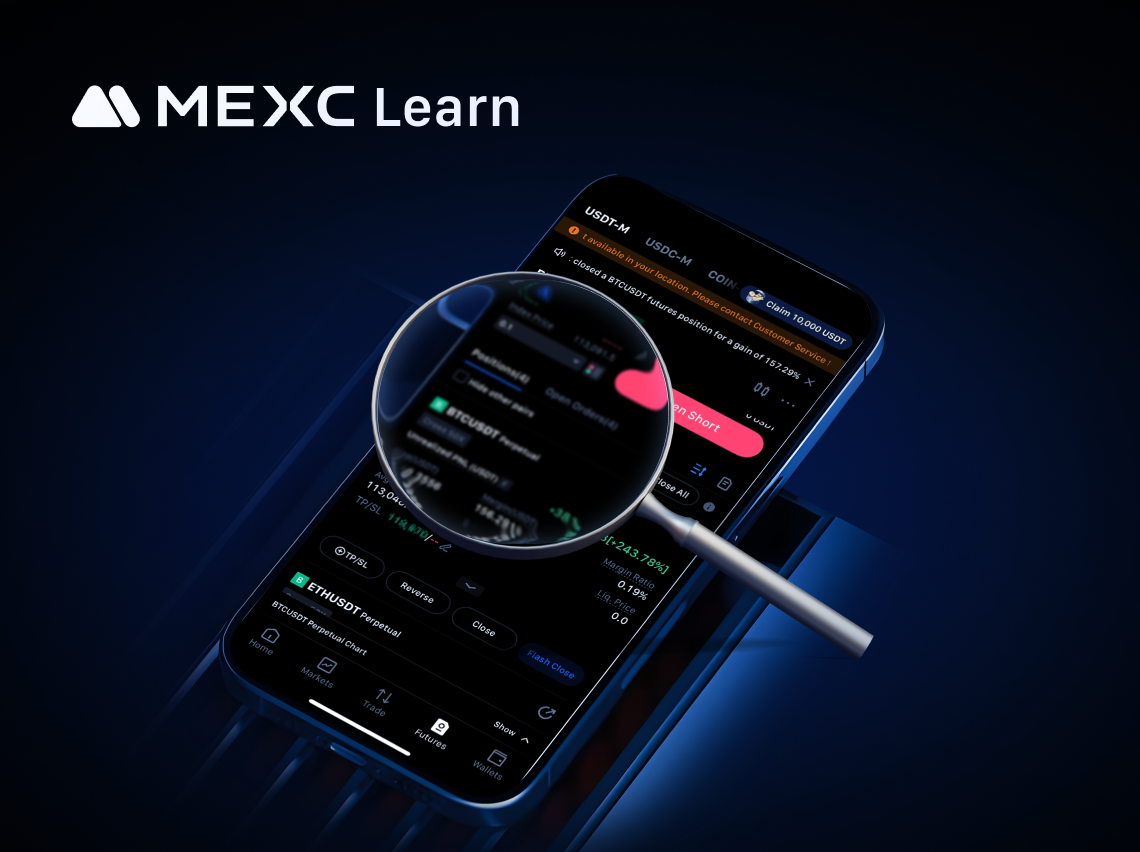
How to View MEXC Futures Account Assets and Open Positions For Improved Trading
Cryptocurrency futures trading has become popular among investors due to its flexibility and wide range of trading pairs. MEXC Futures, in particular, is well recognized by users for offering over 1,3

Analysis of Common Technical Indicators in the Cryptocurrency Market
In crypto trading, technical indicator analysis refers to a quantitative method that uses mathematical and statistical formulas to assess market trends. By processing price and volume data through spe

Common Technical Analysis Theories
Technical analysis is a widely used tool in financial investing, aimed at predicting future market trends by studying historical price movements and trading data. This article will break down the core
