

XRP Price: Down 14% This Week – Can Bulls Hold the $1.40 Level?
TLDR
- XRP price dropped to $1.41, marking its lowest level since November 2024 when Trump won the election
- Technical charts show a bear pennant pattern with a potential downside target of $1.22
- XRP broke below the key $1.60 support level that held during April’s sell-off
- Futures open interest has declined from $4.55 billion on January 6 to $2.61 billion, which could signal a potential trend reversal
- Spot buying volume has dropped sharply since early January, showing reduced demand from investors
XRP is currently trading at $1.43 after hitting a low of $1.41 over the weekend. This marks the lowest price for the token since November 2024.
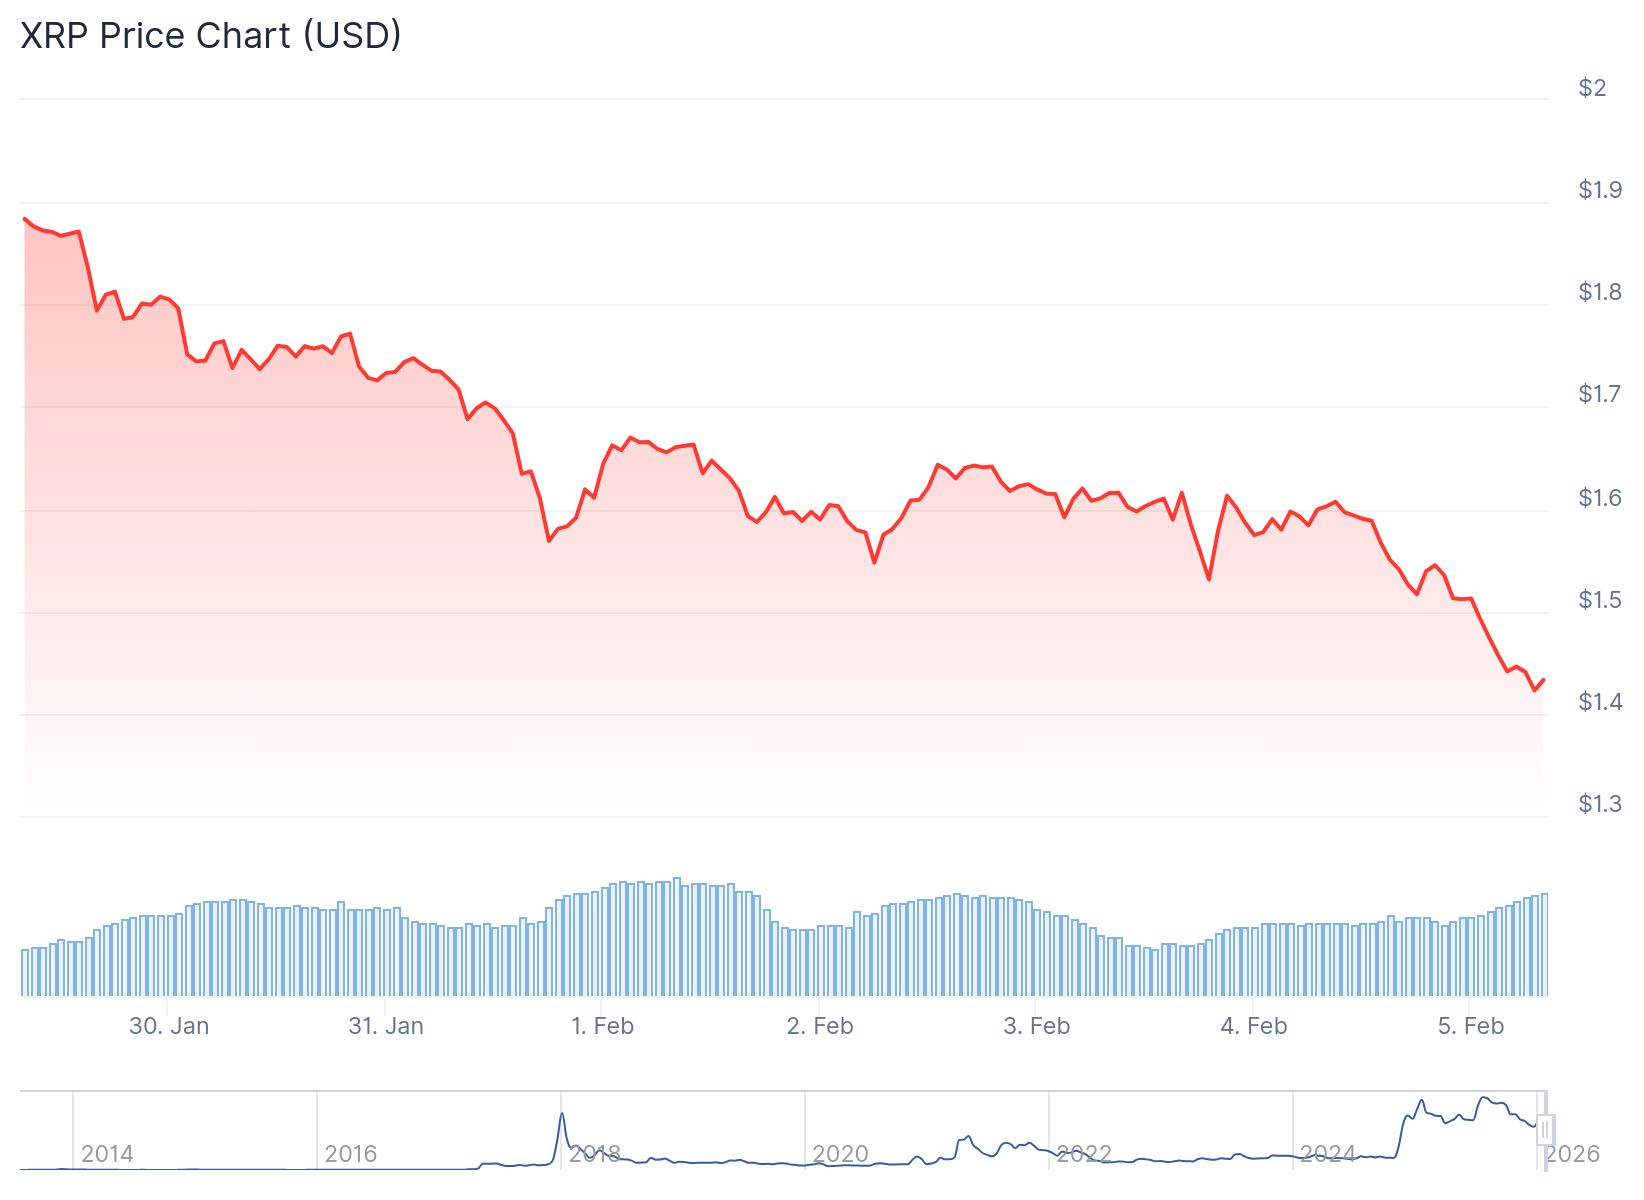 XRP Price
The decline comes as Bitcoin’s price weakness spreads across the crypto market. XRP is used by fintech firm Ripple for cross-border transactions.
The token dropped about 14% on Saturday. It fell from a high of $1.75 to $1.50 during that session.
XRP lost the $1.60 support level for the first time since November 2024. This level had previously acted as a demand zone during April’s sell-off.
Technical charts show XRP has formed a bear pennant pattern on the four-hour timeframe. The token broke below the pennant’s lower trendline on Tuesday.
After the breakdown, the price rebounded briefly to retest the trendline as resistance. This retest occurred around the $1.58 level.
The measured target for the bear pennant pattern is $1.22. This represents a potential 23% drop from current prices.
Declining Trading Activity Points to Weakening Demand
The 90-day Spot Taker Cumulative Volume Delta shows that buy orders have decreased sharply since early January. This metric tracks whether market orders come from buyers or sellers.
 Source: CryptoQuant
Buy-side pressure had dominated the order book since November 2025. However, demand has fallen over the last 30 days according to CryptoQuant data.
Previous sharp drops in spot CVD have been followed by price drawdowns of 28% to 50% within weeks. The current decline in buying activity indicates reduced enthusiasm among investors.
Pseudonymous analyst AltCryptoGems noted that XRP’s recovery to $2.40 in January was a “fakeout.” The analyst said the downtrend remains intact as the price formed a fresh lower low.
Trader Alex Clay stated that after breaking the $1.60 support line of a double bottom pattern, the path is cleared for a drop toward $1.00 or lower. Charts show limited support between the current price and the $1.00 psychological level.
Futures Market Shows Mixed Signals
XRP futures open interest has dropped to $2.61 billion on Wednesday. This is down from $4.55 billion on January 6.
When open interest declines alongside falling prices, it can indicate a weakening bearish trend. This pattern sometimes precedes a potential trend reversal.
The declining open interest could give bulls an opportunity to push the price toward the $1.85 resistance level. This level served as support throughout most of 2025.
Options activity on Deribit shows rising demand for downside protection. Block flows featured demand for put spreads and strangles in the past 24 hours.
Put spreads are bearish strategies that profit when prices decline. Strangles are bets on increased volatility in either direction.
The next major support level for XRP sits near $1.48, which represents the aggregated realized price. If this level breaks, it would put the average holder at a loss.
XRP initially rallied after Trump’s election win in November 2024 on expectations of pro-crypto policies. The token peaked at $3.65 in July last year before entering a sustained downtrend.
The post XRP Price: Down 14% This Week – Can Bulls Hold the $1.40 Level? appeared first on CoinCentral.


Potrebbe anche piacerti

Comparing Market Value: XRP, Dogecoin, Chainlink & BlockDAG Lead the Top-Performing Crypto Today

BTC Price Shaky Near $67K While Oil Surges on Middle East Tensions: What's Next? (April 2 Update)


