

XRP price is at risk as key Ripple USD metrics sink
XRP price remained in a tight range today, Dec. 10, as some of the Ripple USD metrics continued to deteriorate.
- XRP price remained in a tight range this week, even as Bitcoin and other altcoins rallied.
- The adjusted transaction volume of RLUSD stablecoin has dropped by 60% in the last 30 days.
- Similarly, the number of stablecoin transactions dropped by 46% to 424k.
Ripple (XRP) token dropped to a low of $2.0640, down from this week’s high of $2.1780. This decline happened even as Bitcoin (BTC) and other altcoins held steady ahead of the Federal Reserve’s interest rate decision.
Ripple USD metrics are deteriorating
Data compiled by Artemis shows that the important Ripple USD (RLUSD) metrics have deteriorated in the past 30 days.
On the positive side, the supply of RLUSD tokens in circulation has jumped by 23.20% in the past 30 days to over $1.3 billion.
However, there are signs that token usage has waned during this period. The number of active addresses has decreased by 28%.
At the same time, the number of stablecoin transactions dropped by 46% in this period to 424k, while the adjusted transaction volume declined by a whopping 60% to $2.8 billion.
Additionally, most RLUSD transactions occur on the Ethereum (ETH) network, with only a small share on the XRP Ledger network. Its Ethereum transactions on Monday totaled $84 million, compared with XRP Ledger’s $2.7 million.
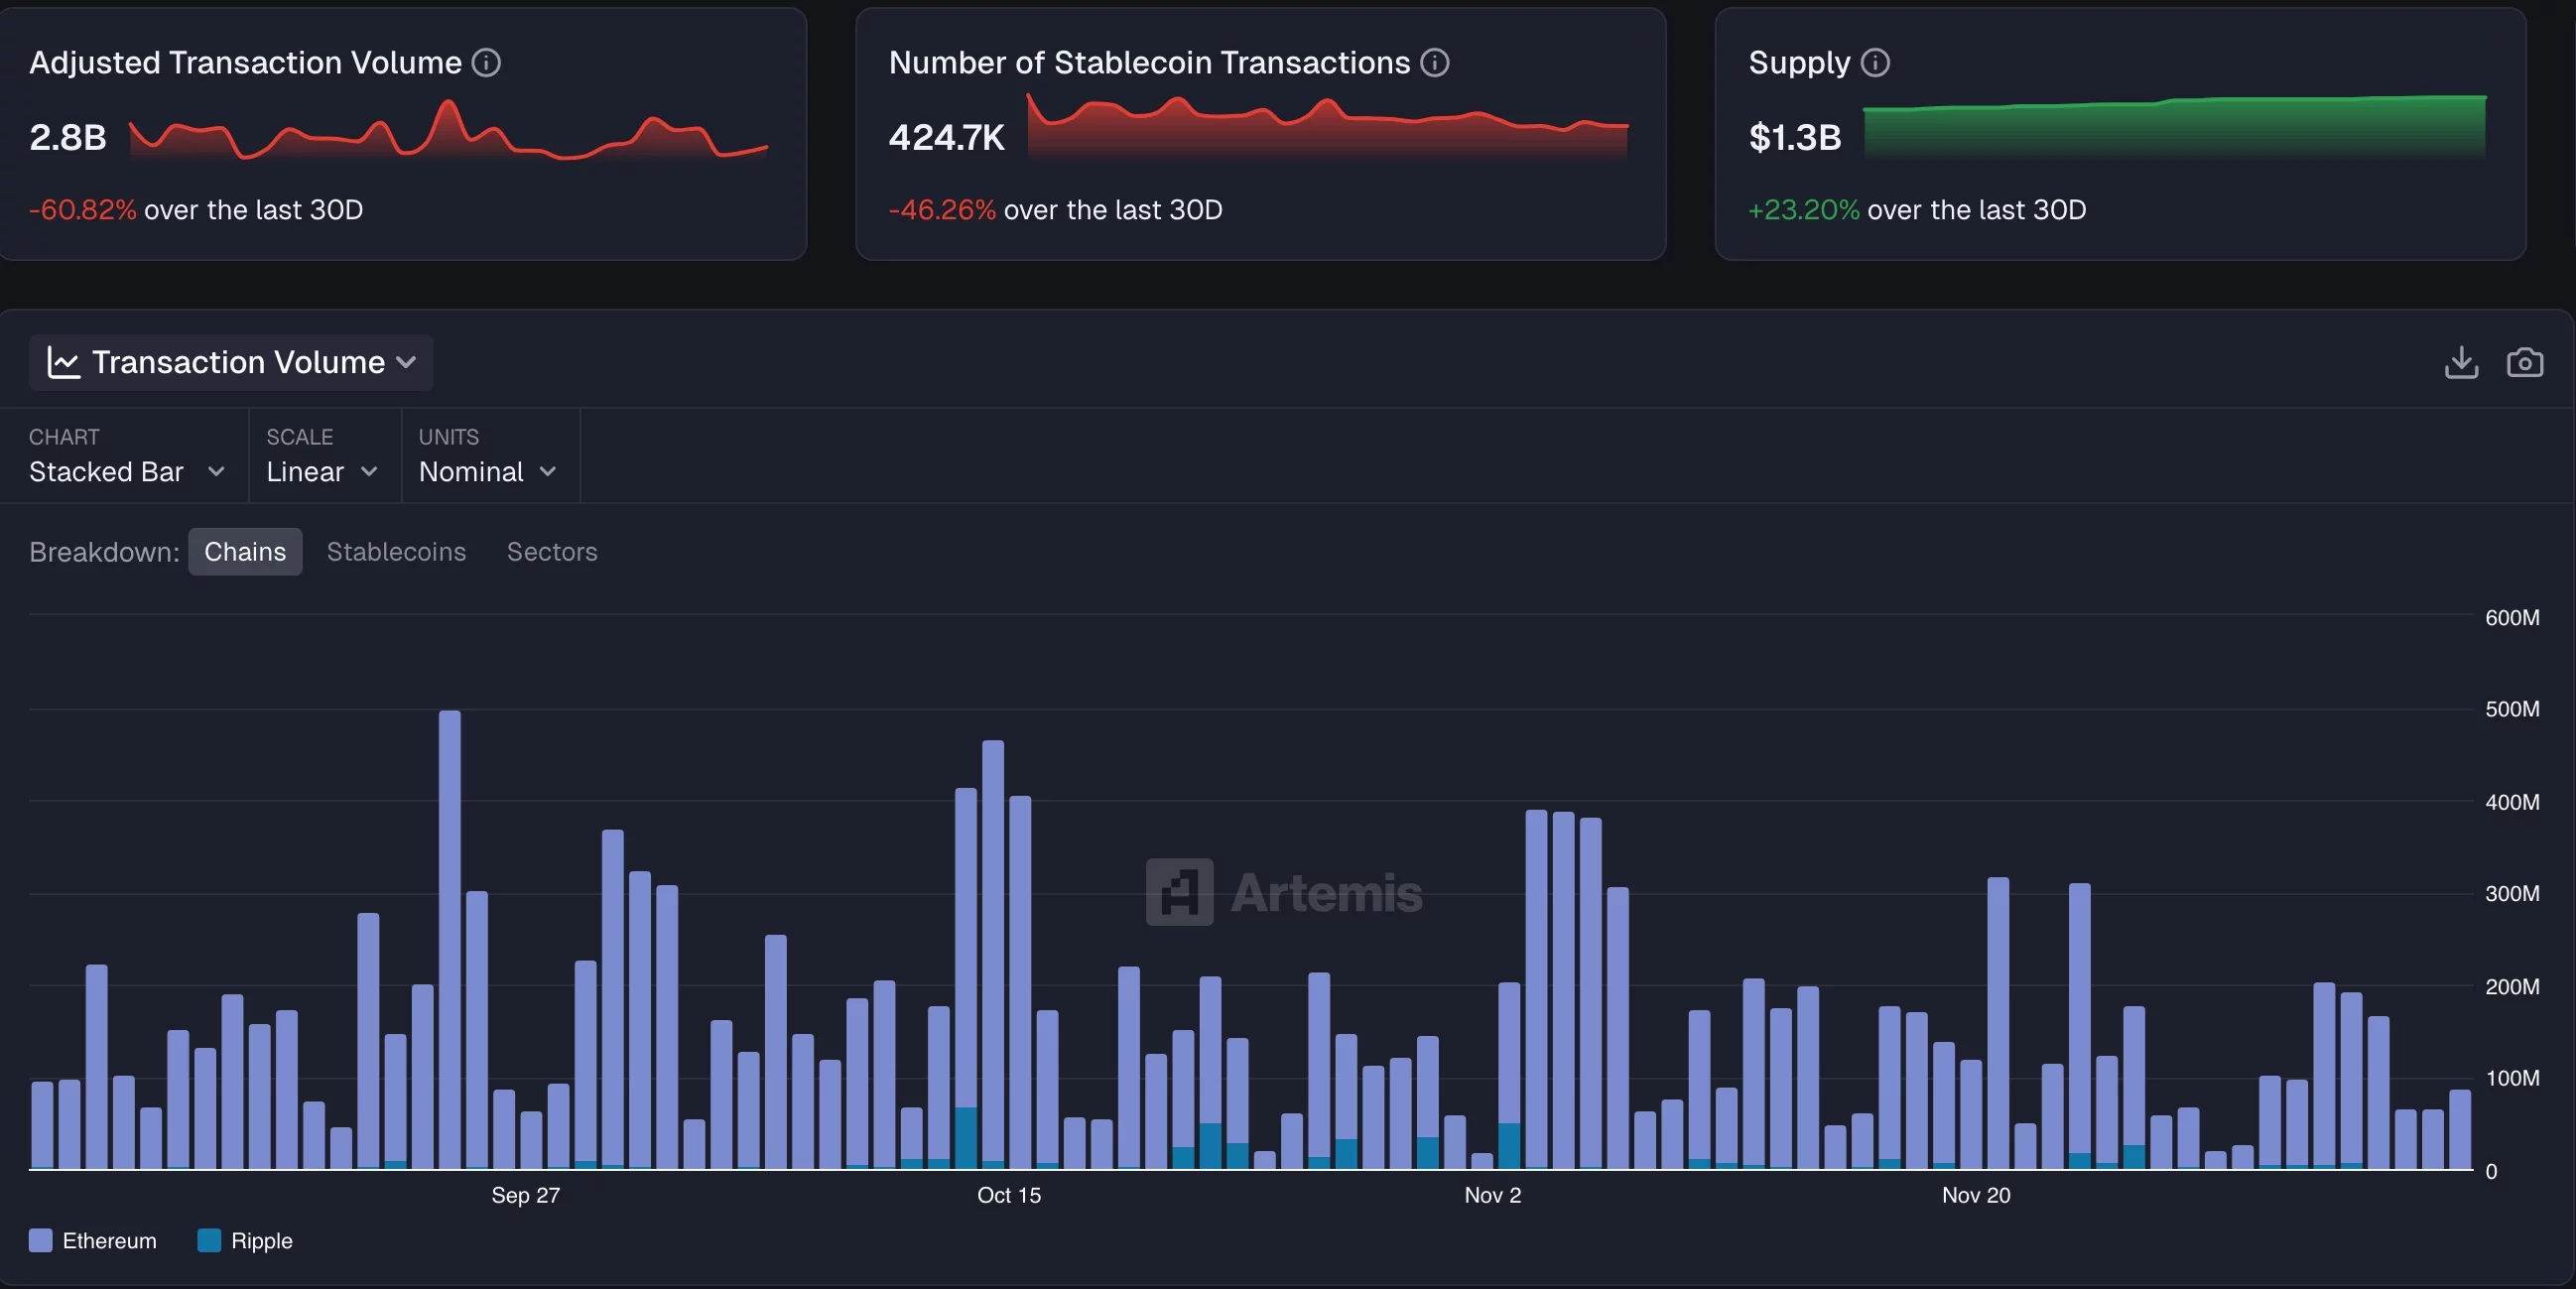 RLUSD transaction volume chart | Source: Artemis
Meanwhile, demand for the recently launched XRP ETFs fell on Tuesday, even as Bitcoin (BTC) and most altcoins rebounded. Total inflows fell to $8.73 million from $38 million the previous day. It was the second-worst day in terms of inflows since the SEC approved Canary’s XRPC ETF.
On the bright side, these ETFs have never experienced outflows, and their cumulative inflows are nearing $1 billion.
XRP price technical analysis
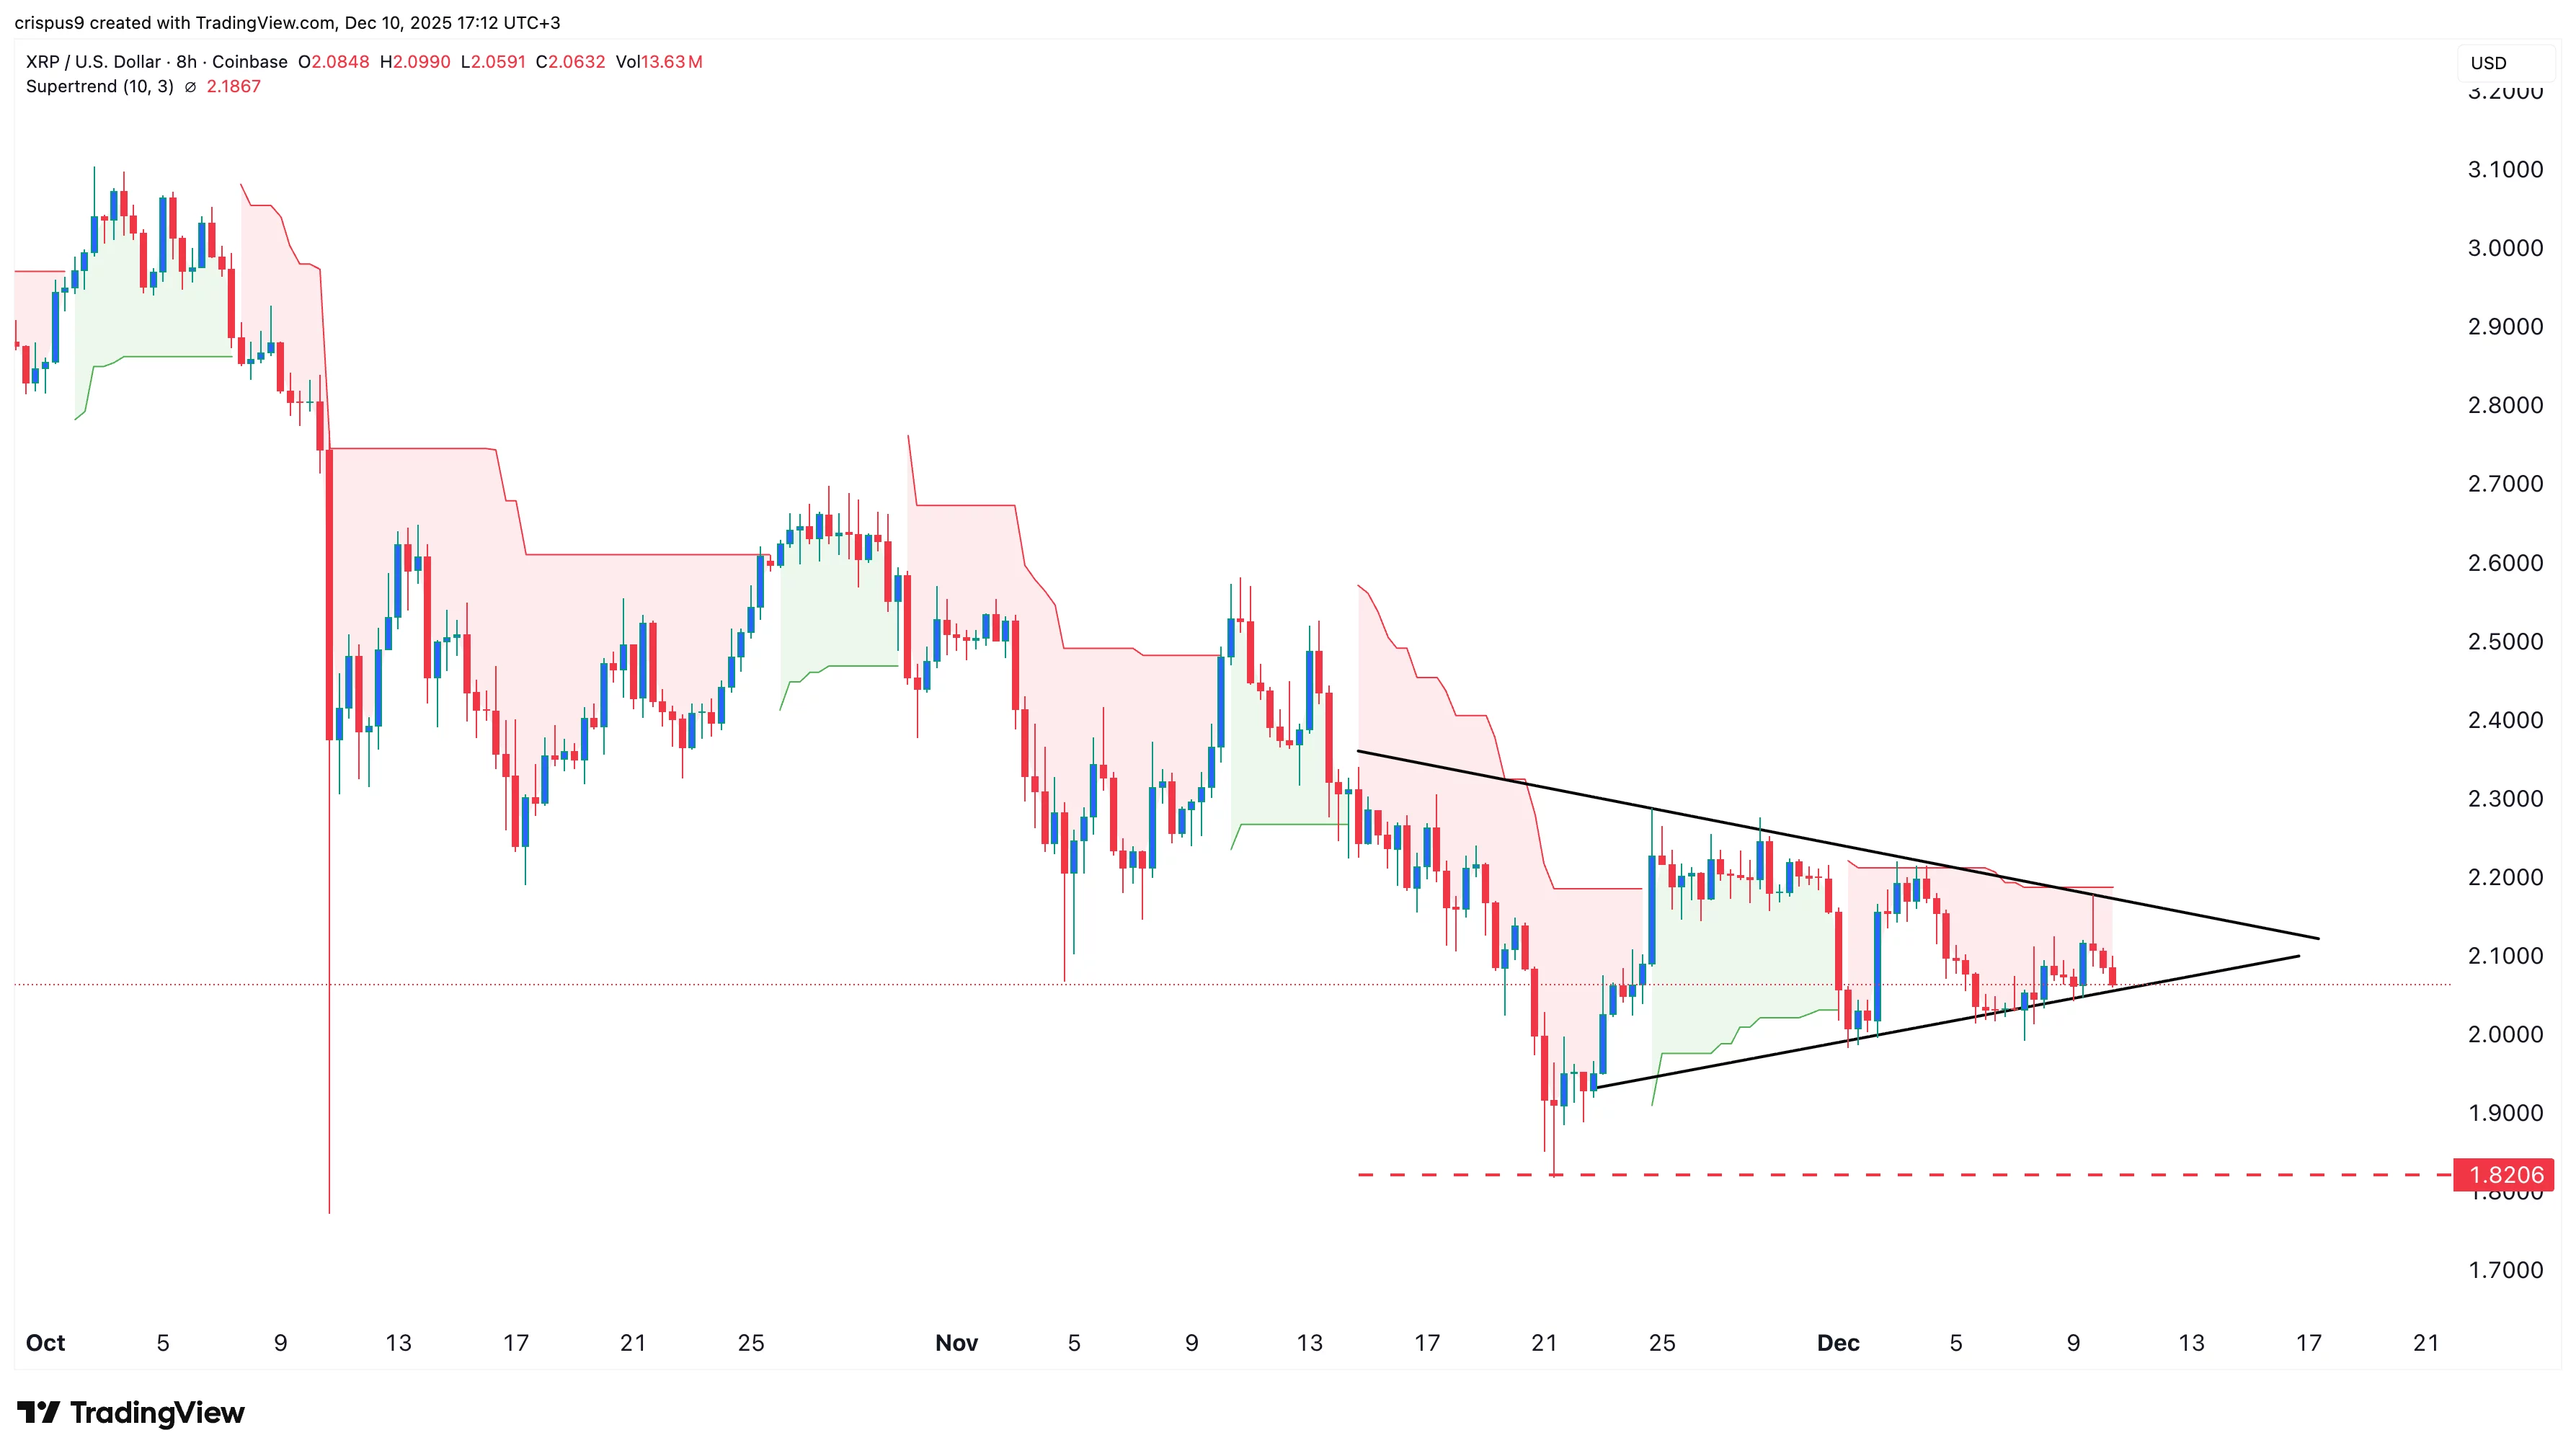
The eight-hour chart shows that the XRP price has remained in a tight range in the past few days. It has formed a symmetrical triangle pattern, with its two lines about to converge.
The token dipped slightly below the Ichimoku cloud, while the Supertrend has remained red throughout the month.
Therefore, there is a risk of a strong bearish breakout to the key support level at $1.8200, its lowest level on Nov. 21. On the other hand, a move above the upper side of the symmetrical triangle will signal further gains.


Potrebbe anche piacerti

Ariana Grande to White House: Don’t use my music for ‘heinous nonsense’

South Korea's 2026 World Cup Starting XI: Can the Taeguk Warriors Defeat Czechia?

CALL FOR PROPOSALS OPEN FOR THE NEW EDITION OF MILANO DIGITAL WEEK PROMOTED BY THE MUNICIPALITY OF MILAN AND ORGANIZED BY TIG – THE INNOVATION GROUP FROM 30 SEPTEMBER TO 4 OCTOBER 2026


Notizie di tendenza
Altro
