Solana started a recovery wave above the $132 zone. SOL price is now consolidating and faces hurdles near the $145 zone. SOL price started a decent recovery wave above $135 and $140 against the US Dollar. The price is now trading above $140 and the 100-hourly simple moving average. There was a break above a key bearish trend line with resistance at $140 on the hourly chart of the SOL/USD pair (data source from Kraken). The price could continue to move up if it clears $145 and $150. Solana Price Aims Higher Levels Solana price remained stable and started a decent recovery wave above $130, beating Bitcoin and Ethereum. SOL was able to climb above the $135 level. There was a move above the 23.6% Fib retracement level of the downward move from the $172 swing high to the $129 low. Besides, there was a break above a key bearish trend line with resistance at $140 on the hourly chart of the SOL/USD pair. Solana is now trading above $140 and the 100-hourly simple moving average. On the upside, immediate resistance is near the $145 level. The next major resistance is near the $150 level. The main resistance could be $155 and the 61.8% Fib retracement level of the downward move from the $172 swing high to the $129 low. A successful close above the $155 resistance zone could set the pace for another steady increase. The next key resistance is $165. Any more gains might send the price toward the $172 level. Another Drop In SOL? If SOL fails to rise above the $150 resistance, it could continue to move down. Initial support on the downside is near the $138 zone. The first major support is near the $135 level. A break below the $135 level might send the price toward the $128 support zone. If there is a close below the $128 support, the price could decline toward the $120 zone in the near term. Technical Indicators Hourly MACD – The MACD for SOL/USD is gaining pace in the bullish zone. Hourly Hours RSI (Relative Strength Index) – The RSI for SOL/USD is above the 50 level. Major Support Levels – $138 and $135. Major Resistance Levels – $150 and $155.Solana started a recovery wave above the $132 zone. SOL price is now consolidating and faces hurdles near the $145 zone. SOL price started a decent recovery wave above $135 and $140 against the US Dollar. The price is now trading above $140 and the 100-hourly simple moving average. There was a break above a key bearish trend line with resistance at $140 on the hourly chart of the SOL/USD pair (data source from Kraken). The price could continue to move up if it clears $145 and $150. Solana Price Aims Higher Levels Solana price remained stable and started a decent recovery wave above $130, beating Bitcoin and Ethereum. SOL was able to climb above the $135 level. There was a move above the 23.6% Fib retracement level of the downward move from the $172 swing high to the $129 low. Besides, there was a break above a key bearish trend line with resistance at $140 on the hourly chart of the SOL/USD pair. Solana is now trading above $140 and the 100-hourly simple moving average. On the upside, immediate resistance is near the $145 level. The next major resistance is near the $150 level. The main resistance could be $155 and the 61.8% Fib retracement level of the downward move from the $172 swing high to the $129 low. A successful close above the $155 resistance zone could set the pace for another steady increase. The next key resistance is $165. Any more gains might send the price toward the $172 level. Another Drop In SOL? If SOL fails to rise above the $150 resistance, it could continue to move down. Initial support on the downside is near the $138 zone. The first major support is near the $135 level. A break below the $135 level might send the price toward the $128 support zone. If there is a close below the $128 support, the price could decline toward the $120 zone in the near term. Technical Indicators Hourly MACD – The MACD for SOL/USD is gaining pace in the bullish zone. Hourly Hours RSI (Relative Strength Index) – The RSI for SOL/USD is above the 50 level. Major Support Levels – $138 and $135. Major Resistance Levels – $150 and $155.

Solana (SOL) Aims Recovery Run, $155 Resistance Now Back in Focus

2025/11/20 13:08
2 min di lettura
Per feedback o dubbi su questo contenuto, contattateci all'indirizzo crypto.news@mexc.com.

Solana started a recovery wave above the $132 zone. SOL price is now consolidating and faces hurdles near the $145 zone.

  • SOL price started a decent recovery wave above $135 and $140 against the US Dollar.
  • The price is now trading above $140 and the 100-hourly simple moving average.
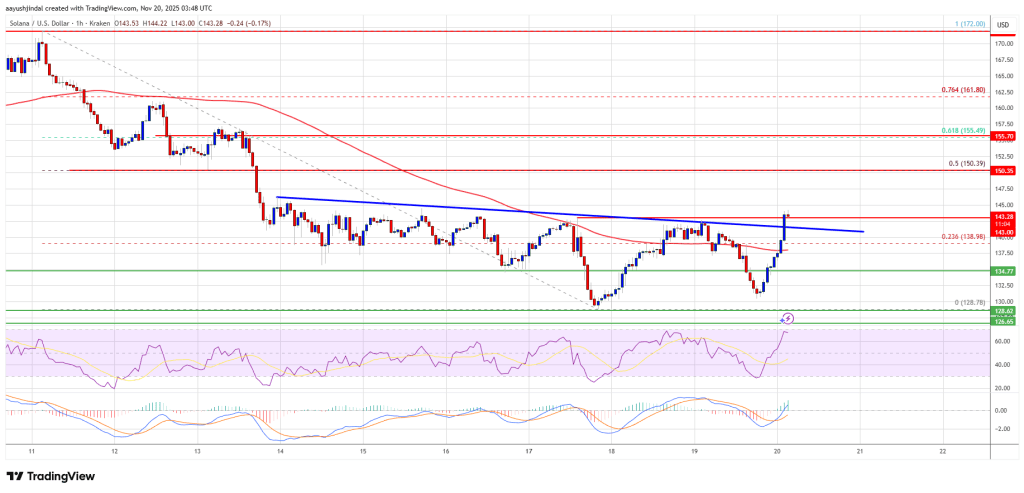
  • There was a break above a key bearish trend line with resistance at $140 on the hourly chart of the SOL/USD pair (data source from Kraken).
  • The price could continue to move up if it clears $145 and $150.

Solana Price Aims Higher Levels

Solana price remained stable and started a decent recovery wave above $130, beating Bitcoin and Ethereum. SOL was able to climb above the $135 level.

There was a move above the 23.6% Fib retracement level of the downward move from the $172 swing high to the $129 low. Besides, there was a break above a key bearish trend line with resistance at $140 on the hourly chart of the SOL/USD pair.

Solana is now trading above $140 and the 100-hourly simple moving average. On the upside, immediate resistance is near the $145 level. The next major resistance is near the $150 level.
Solana Price

The main resistance could be $155 and the 61.8% Fib retracement level of the downward move from the $172 swing high to the $129 low. A successful close above the $155 resistance zone could set the pace for another steady increase. The next key resistance is $165. Any more gains might send the price toward the $172 level.

Another Drop In SOL?

If SOL fails to rise above the $150 resistance, it could continue to move down. Initial support on the downside is near the $138 zone. The first major support is near the $135 level.

A break below the $135 level might send the price toward the $128 support zone. If there is a close below the $128 support, the price could decline toward the $120 zone in the near term.

Technical Indicators

Hourly MACD – The MACD for SOL/USD is gaining pace in the bullish zone.

Hourly Hours RSI (Relative Strength Index) – The RSI for SOL/USD is above the 50 level.

Major Support Levels – $138 and $135.

Major Resistance Levels – $150 and $155.

Opportunità di mercato
Logo Solana
Valore Solana (SOL)
$77.79
$77.79$77.79
+2.07%
USD
Grafico dei prezzi in tempo reale di Solana (SOL)

Get Covered, Share 1M USDT

Get Covered, Share 1M USDTGet Covered, Share 1M USDT

Higher VVIP tiers, higher compensation odds.

Disclaimer: gli articoli ripubblicati su questo sito provengono da piattaforme pubbliche e sono forniti esclusivamente a scopo informativo. Non riflettono necessariamente le opinioni di MEXC. Tutti i diritti rimangono agli autori originali. Se ritieni che un contenuto violi i diritti di terze parti, contatta crypto.news@mexc.com per la rimozione. MEXC non fornisce alcuna garanzia in merito all'accuratezza, completezza o tempestività del contenuto e non è responsabile per eventuali azioni intraprese sulla base delle informazioni fornite. Il contenuto non costituisce consulenza finanziaria, legale o professionale di altro tipo, né deve essere considerato una raccomandazione o un'approvazione da parte di MEXC.

Record Ads, Stock Down 7%

Record Ads, Stock Down 7%Record Ads, Stock Down 7%

Jul 29: Meta earnings face the market's question.