

XRP consolidates at $2 level for 14 months as technical analysts eye potential breakout
XRP has maintained a price level around $2 for approximately 14 months.
- XRP entered a correction phase following a rally that began in late 2024.
- The price level near $2 has served as a support zone over the 14-month period.
- Funding rates on major cryptocurrency exchanges have remained predominantly negative since December.
The cryptocurrency has established a technical consolidation zone at this price point, with market observers monitoring for signs of a potential trend reversal.
According to technical analysis published by crypto analyst Darkfost, there are similarities between current market conditions and patterns observed in April 2025, when the asset experienced a price reversal near the established base level. The analyst cited short positioning dynamics as a contributing factor to that previous movement.
Funding rates on major cryptocurrency exchanges have remained predominantly negative since December, according to data from Binance. Negative funding rates typically indicate a prevalence of leveraged short positions in the market.
XRP entered a correction phase following a rally that began in late 2024. The asset has experienced two previous instances of negative funding rates followed by price increases: between August and September 2024, and during April 2025, according to historical market data.
The asset remains below a descending resistance trendline and horizontal resistance level, which technical analysts identify as barriers to upward price movement. This resistance zone aligns with a Fibonacci retracement level used in technical analysis.
Technical analysis of the weekly chart shows XRP trading below the 9-week Simple Moving Average. The price level near $2 has served as a support zone over the 14-month period, with multiple attempts to break below it failing to sustain downward movement.
The Relative Strength Index, a momentum indicator, has displayed bullish divergence, suggesting reduced downward momentum despite recent price levels, according to technical analysis.
Market analysts state that a weekly closing price above the identified resistance zone would represent a technical breakout, while a sustained move below the support level would indicate further downside potential.
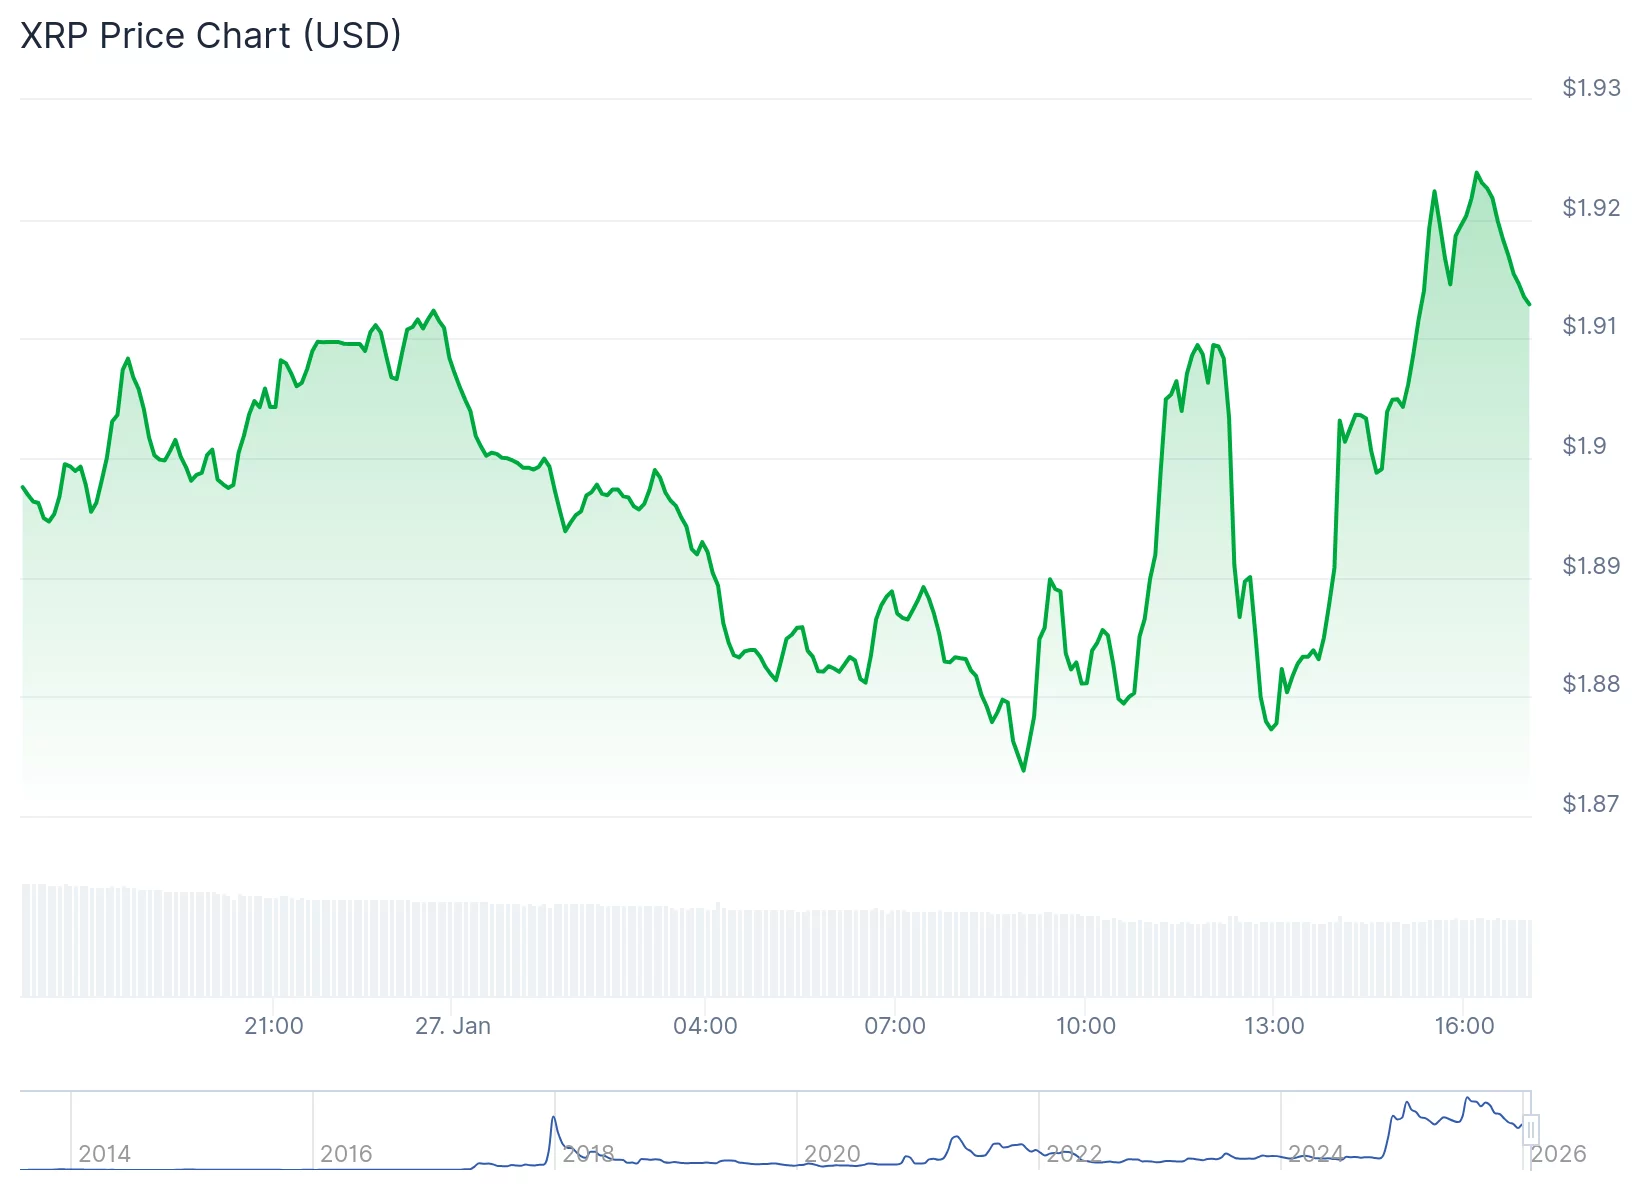
XRP is currently trading near $2, according to CoinGecko. See below.


Mohlo by se vám také líbit

Stablecoin payments could hit $1.5 quadrillion by 2035, reshaping global finance

Super Micro Computer (SMCI) Stock Jumps 6% as Traders Bet Big on Calls


