

XRP (XRP) Price Flashes Reversal Signs as Whales Buy 190M Tokens Amid Technical Indicators
Key Takeaways
- XRP currently trades in the $1.32–$1.35 range with several technical signals pointing toward a possible cycle low
- Weekly RSI touched extreme oversold territory at 29 on March 2, rebounding to 34 in recent sessions
- MACD indicator reached record lows and shows signs of an impending bullish crossover
- Approximately 500 million XRP tokens were purchased near $1.30, establishing it as critical support
- A breach below $1.27–$1.30 could trigger a decline to $1.15–$1.12, with bearish scenarios targeting $0.80
After eight months of sustained bearish pressure, XRP appears to be showing early signs of a potential trend reversal based on multiple technical signals that have historically coincided with market bottoms.
The digital asset is currently changing hands between $1.32 and $1.35, with market participants focused intensely on whether the $1.30 support zone can withstand further selling pressure.
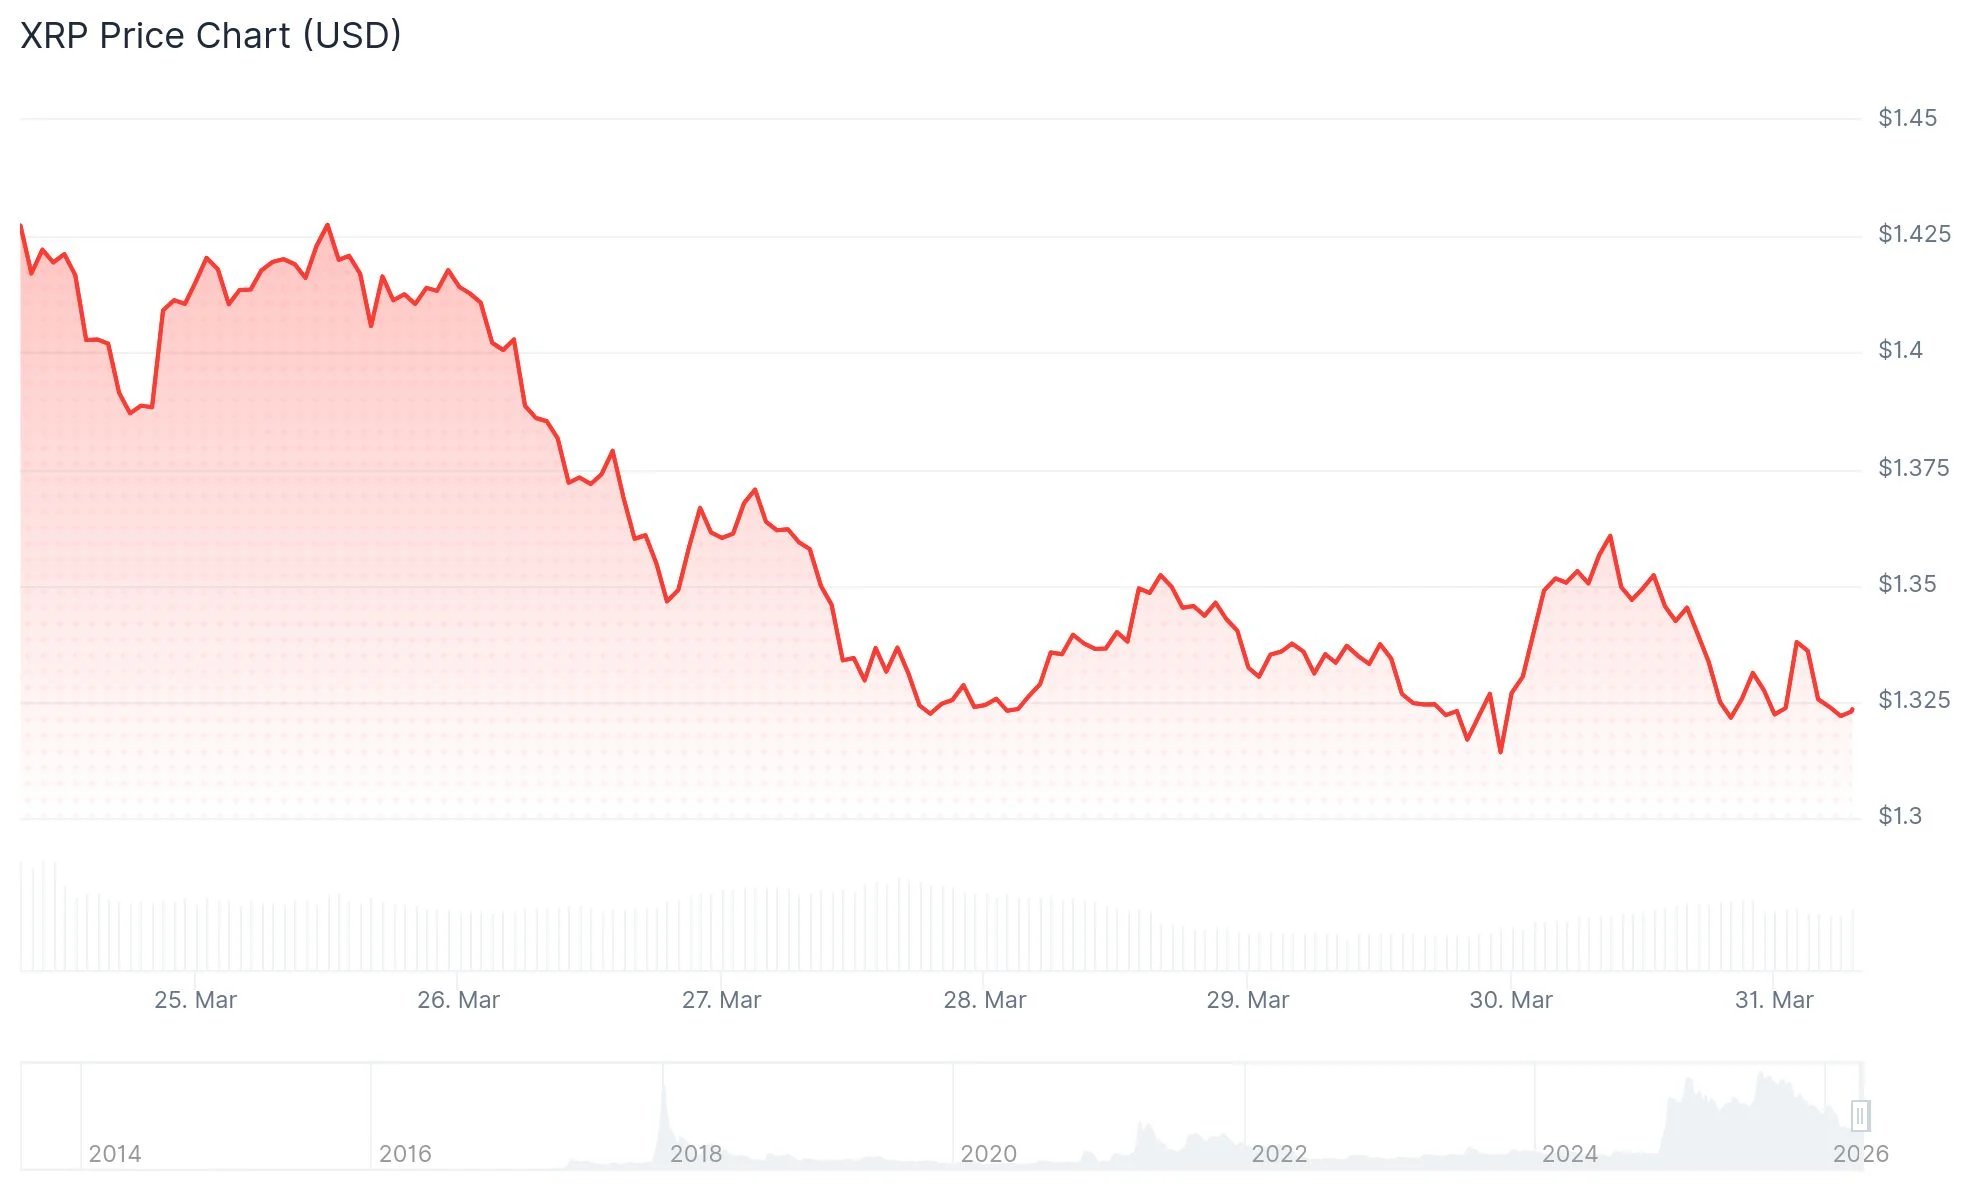 XRP Price
On the weekly timeframe, the Relative Strength Index plunged to 29 on March 2, firmly in oversold territory. The metric has since climbed back to 34. Previous instances when XRP’s RSI reached similarly depressed levels have often preceded substantial price rebounds.
Meanwhile, the Moving Average Convergence Divergence has declined to unprecedented lows in XRP’s trading history. The indicator is now approaching a bullish crossover pattern—a technical development that has previously coincided with major macro bottoms.
When these two conditions—an oversold RSI combined with a MACD bullish cross—have emerged simultaneously in the past, XRP experienced rallies ranging from 74% to 230%. Such scenarios played out in 2022 and again during mid-2024.
Critical Support Zone at $1.30
Market analyst Egrag Crypto characterized the $1.30 region as “a very sensitive level” where “the market chooses direction.” According to his analysis, maintaining this zone could facilitate upward movement, while losing it might result in a retest of $1.15.
Blockchain analytics from Glassnode reveal that roughly 500 million XRP tokens were accumulated around the $1.30 price point. This substantial concentration of purchasing activity at this level establishes a significant demand zone that could act as a price floor.
Should $1.30 fail to hold, the subsequent support level lies between $1.15 and $1.12, where the 200-week simple moving average is currently positioned. Breaking beneath that threshold would potentially activate a bear flag pattern with a downside target near $0.80.
Analyst Arthur questioned on X whether the weekly RSI on XRP reaching multi-year lows might be “flashing a long-term bottom signal.” Fellow analyst Cryptoinsightuk pointed out that this marks only the second time XRP has entered oversold RSI territory, with the previous occurrence in July 2022 precisely marking the cycle bottom.
XRP/BTC Pair Shows Stabilization
Against Bitcoin, XRP is also demonstrating signs of stabilization near the lower boundary of an extended consolidation pattern. The previous time XRP formed a bottom versus BTC at comparable levels was June 2025, which sparked a 56% increase in the XRP/BTC pair and propelled XRP’s dollar price up 92% to reach $3.66.
Blockchain data indicates that whale-tier accumulation has intensified recently. According to analyst Ali Charts, large holders acquired 190 million XRP tokens during the past seven days alone. Additionally, withdrawals from exchanges have increased significantly, a pattern that generally suggests investors are moving tokens into cold storage for extended holding periods.
For bulls to validate a genuine trend reversal, XRP must reclaim and break above the $1.61 range high on sustained volume.
The post XRP (XRP) Price Flashes Reversal Signs as Whales Buy 190M Tokens Amid Technical Indicators appeared first on Blockonomi.
Ayrıca Şunları da Beğenebilirsiniz

The Role of Reference Points in Achieving Equilibrium Efficiency in Fair and Socially Just Economies

XLM Price Prediction: Stellar Targets $0.20 by Mid-2026 Amid Technical Consolidation


