UNI continues its downtrend while approaching a critical support zone at $3.51. The buyer zone around $3.4758 is in a key position for short-term recovery; a breakdown would increase the risk of deepening toward $3.27.
Current Price Position and Critical Levels
UNI is stuck in the $3.48-$3.62 range with a 24-hour 2.44% drop at its current $3.51 price, maintaining its overall downtrend structure. The price is trading below EMA20 ($3.69), which gives a short-term bearish signal; RSI at 42.14 is not approaching oversold but momentum is weak. The Supertrend indicator is bearish and points to $4.16 resistance. In multi-timeframe (MTF) analysis, 11 strong levels were detected: 2 supports/2 resistances on 1D, 2 supports/1 resistance on 3D, 1 support/4 resistance confluence on 1W. This highlights a liquidity hunt scenario where the price is being tested at the $3.4758 support block; volume is low at $49.84M, meaning big players might be quietly accumulating positions.
Support Levels: Buyer Zones
Primary Support
$3.4758 (Strength Score: 68/100) – This level stands out with order block (OB) confluence on 1D and 3D timeframes. The price was rejected from here twice in the last 72 hours, a demand zone where buyers entered with high volume spikes. It fully aligns with EMA50 ($3.48) and is supported by Fibonacci 0.618 retracement. Historically 5% above the early March swing low, ideal for liquidity collection. A breakdown would trigger a stop hunt, leading to $3.27.
Secondary Support and Stop Levels
$3.2723 (Strength Score: 63/100) – Main support on 1W timeframe and extension of 3D OB; stems from the strong rejection at the end of February, when volume increased 3x. Strengthened by 1W EMA200 ($3.28) confluence. Secondary invalidation below $3.20; a break here would accelerate the downtrend and bring the $1.83 target (low score though) into play. Suggested stop-loss at $3.46 to minimize risk.
Resistance Levels: Seller Zones
Near-Term Resistances
$3.5832 (Strength Score: 74/100) – Short-term supply zone, order block from the recent 1D high. When price approached here, it showed 1.5% rejection in 24 hours, with volume distribution favoring sellers. Confluence with EMA20 ($3.69) approach; $15M+ volume required for breakout. A break could be interpreted as a liquidity grab; monitor UNI Spot Analysis.
Main Resistance and Targets
$3.7204 (Strength Score: 75/100) – Premium supply with 1D/1W confluence, originating from mid-March wick high. One of 4 resistances on 1W, aligns with Fibonacci 0.236 extension. Rejected 4 times in historical tests, with large sell limit orders here. Upside target $5.1464 (low score, but possible with BTC rally); invalidation above $3.80.
Liquidity Map and Big Players
Big players (smart money) are collecting liquidity below $3.4758; stop-loss clusters at $3.46, equal lows at $3.48 could be hunted. Above, sell-side liquidity at $3.72, high risk of breakout fakeout. Bearish structure on 1W, imbalances filling at $3.60-$3.65. Volume profile low, accumulation phase expected; long/short ratio 0.85 on futures perpetuals, critical for UNI Futures Analysis.
Bitcoin Correlation
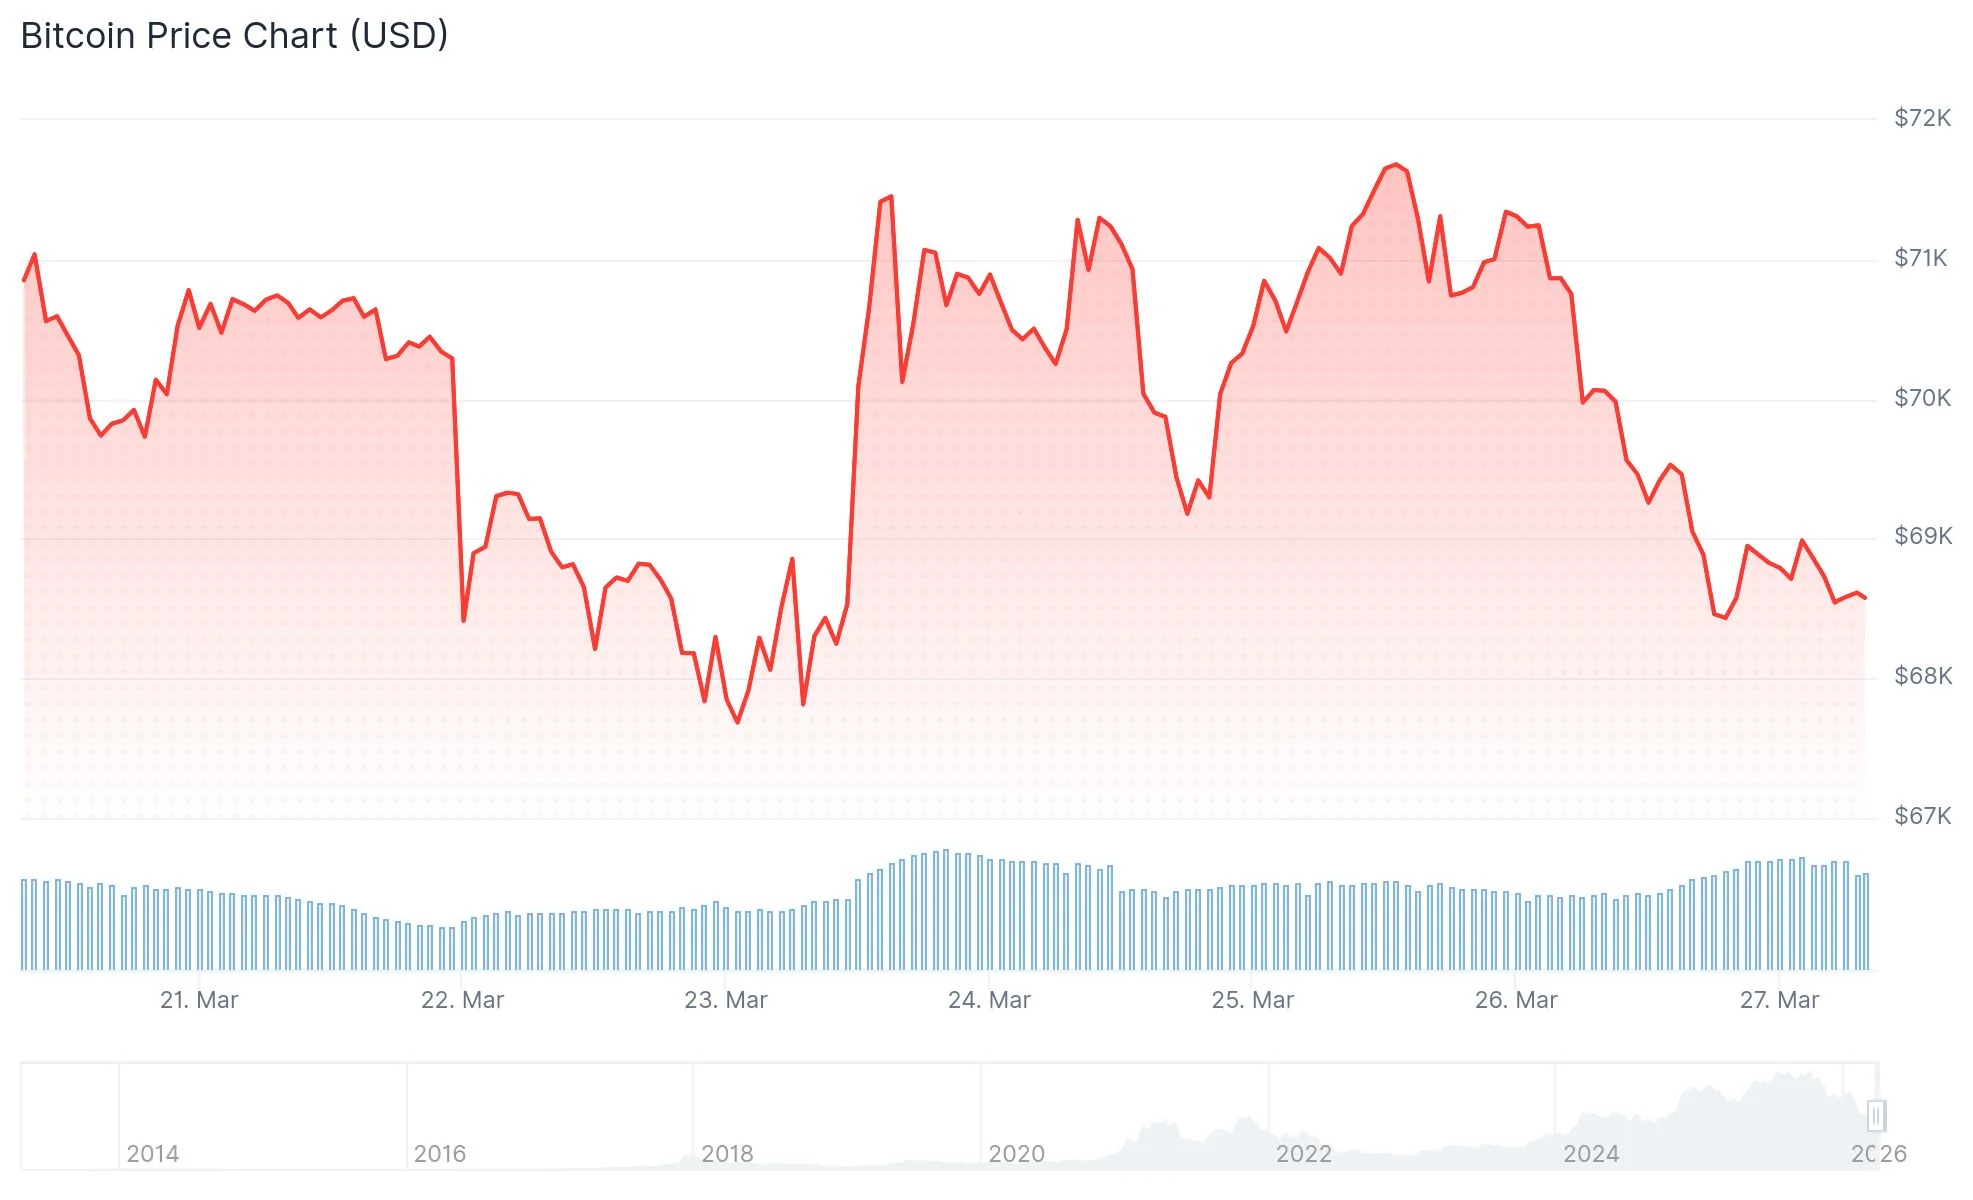
BTC in downtrend at $68,730 (1.79% drop), Supertrend bearish; altcoins like UNI affected with 0.85 correlation. If BTC $68,134 support breaks, UNI drops to $3.27; BTC breaking $68,809 resistance triggers $3.72 breakout with alt season signal. As BTC dominance rises (currently 55+%), short bias on UNI; main BTC levels: support $66,407/$62,910, resistance $70,605/$74,422. UNI rally limited without BTC stabilization.
Trading Plan and Level-Based Strategy
Level-based outlook: Long for bounce at $3.4758 (target $3.58, stop $3.46, R/R 1:2.5); short on breakdown to $3.27 (target $3.00, stop $3.52). Short setup on $3.58 rejection, long on $3.72 breakout confluence. MTF bearish, watch for RSI divergence. Combine this outlook with risk management; high volatility, position sizing 1-2%.
This analysis uses the market views and methodology of Chief Analyst Devrim Cacal.
Source: https://en.coinotag.com/analysis/uni-technical-analysis-march-27-2026-support-and-resistance-levels