Ethereum price has held above $1,900 against the current crypto market volatility. However, a bearish crossover continues to threaten a drop below this crucial Ethereum price has held above $1,900 against the current crypto market volatility. However, a bearish crossover continues to threaten a drop below this crucial

Will Ethereum price fall under $1,900 as a bearish crossover forms?

2026/03/09 16:17
Okuma süresi: 2 dk
Bu içerikle ilgili geri bildirim veya endişeleriniz için lütfen crypto.news@mexc.com üzerinden bizimle iletişime geçin.

Ethereum price has held above $1,900 against the current crypto market volatility. However, a bearish crossover continues to threaten a drop below this crucial level.

Summary
  • Ethereum price approached the $1,900 support as liquidations mounted and investors moved away from risk assets.
  • A bearish SMA crossover has been confirmed on the daily chart.

According to data from crypto.news, Ethereum (ETH) price briefly fell 12% to an intraday low of $1,930 on Monday before retracing back part of its loss as it stabilised around $2,000 at press time.

Ethereum has spent the last three sessions oscillating within a tight $1,900 to $2,000 corridor as traders weighed escalating geopolitical risks in the Middle East against a backdrop of persistent macroeconomic uncertainty.

Ethereum price fell after Bitcoin dropped toward $65,000 in response to oil prices climbing past $100 worldwide amid fears of a potential blockade in the Strait of Hormuz as tensions between the U.S. and Iran escalated.

As Ethereum price dipped, it liquidated highly leveraged bets across the derivatives market. Data from CoinGlass shows nearly $75 million was liquidated from ETH futures over the past 24 hours, with long positions accounting for the majority.

A jump in long liquidations can intensify selling pressure and accelerate downside momentum, particularly during periods of heightened market volatility, as experienced over the past 24 hours.

Ethereum price risks drop under $1,900

Technical indicators seem to suggest bears could soon gain the upper hand. On the daily chart, the 20-day moving average for ETH price action has confirmed a bearish crossover with the 50-day SMA. As long as these key moving averages continue to move downwards, the asset could struggle to find its footing.

Ethereum price has formed a bearish SMA crossover on the daily chart.

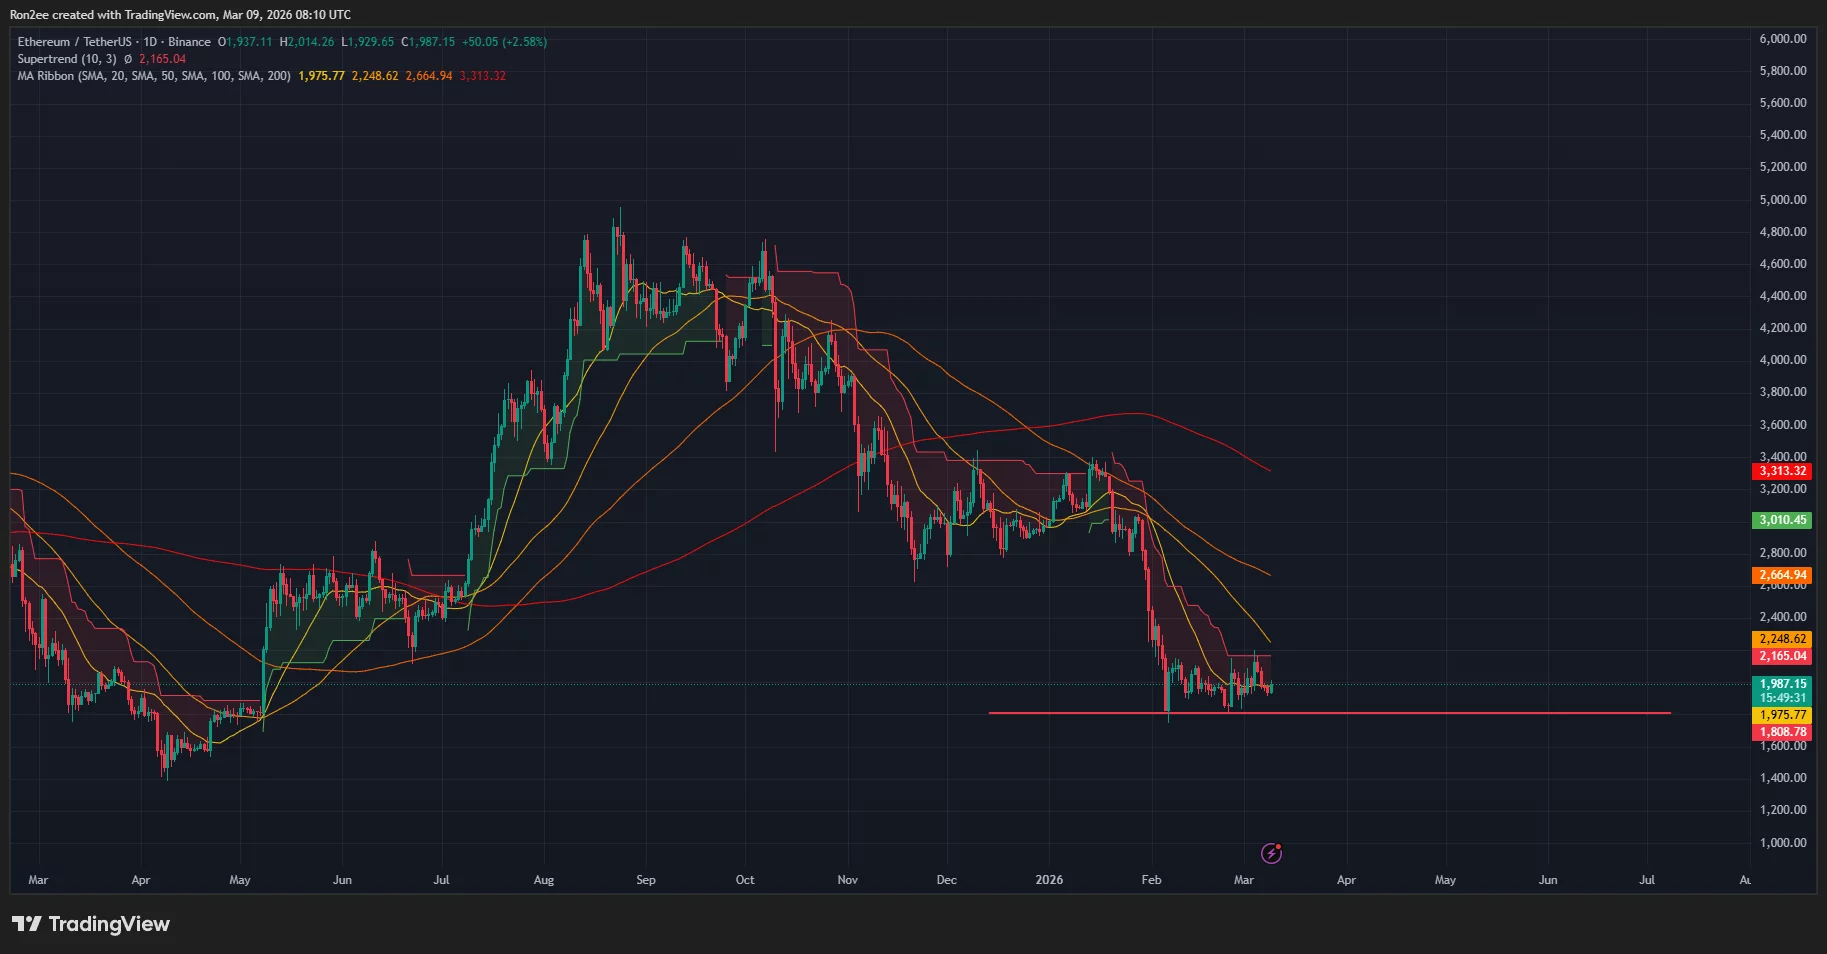
Ethereum price has also moved below the Supertrend line, which confirms that sellers are currently in control. At the same time, the Chaikin Money Flow index showed a negative reading, an indication that capital has been flowing out from the asset.

Hence, Ethereum price remains at high risk of dropping under $1,900, which could trigger bears to retest the Feb. 24 swing low near $1,800.

On the contrary, if price returns above the 50-day SMA at $2,248, traders may view this as a positive change in the current market momentum.

Disclosure: This article does not represent investment advice. The content and materials featured on this page are for educational purposes only.

Piyasa Fırsatı
Ucan fix life in1day Logosu
Ucan fix life in1day Fiyatı(1)
$0.0004287
$0.0004287$0.0004287
-8.55%
USD
Ucan fix life in1day (1) Canlı Fiyat Grafiği
Sorumluluk Reddi: Bu sitede yeniden yayınlanan makaleler, halka açık platformlardan alınmıştır ve yalnızca bilgilendirme amaçlıdır. MEXC'nin görüşlerini yansıtmayabilir. Tüm hakları telif sahiplerine aittir. Herhangi bir içeriğin üçüncü taraf haklarını ihlal ettiğini düşünüyorsanız, kaldırılması için lütfen crypto.news@mexc.com ile iletişime geçin. MEXC, içeriğin doğruluğu, eksiksizliği veya güncelliği konusunda hiçbir garanti vermez ve sağlanan bilgilere dayalı olarak alınan herhangi bir eylemden sorumlu değildir. İçerik, finansal, yasal veya diğer profesyonel tavsiye niteliğinde değildir ve MEXC tarafından bir tavsiye veya onay olarak değerlendirilmemelidir.

Ayrıca Şunları da Beğenebilirsiniz

Dogecoin Rally Sparks Meme Coin Frenzy – Is Maxi Doge the Next to Pump?

Dogecoin Rally Sparks Meme Coin Frenzy – Is Maxi Doge the Next to Pump?

The crypto market is once again buzzing with excitement as meme coins prepare for what could be another explosive rally. Meme coin market capitalization rose 7% in the past 24 hours, with trading volume up 50%, according to CoinMarketCap, as both whales and retail traders return. This surge of momentum has many calling it the […]
Paylaş
The Cryptonomist2025/09/19 02:18
Litecoin Fluctuates Below The $116 Threshold

Litecoin Fluctuates Below The $116 Threshold

The post Litecoin Fluctuates Below The $116 Threshold appeared on BitcoinEthereumNews.com. Sep 17, 2025 at 23:05 // Price Litecoin price analysis by Coinidol.com: LTC price has slipped below the moving average lines after hitting resistance at $120. Litecoin price long-term prediction: bearish The 21-day SMA support helped to alleviate the selling pressure. In other words, the price of the cryptocurrency is above the 21-day SMA support but below the 50-day SMA barrier. This suggests that Litecoin will be trapped in a narrow range for a few days. If the 21-day SMA support or the 50-day SMA barrier is overreached, the cryptocurrency will trend upwards. For example, if the LTC price breaks through the 50-day SMA barrier, it will rise to a high of $124. Litecoin will fall to its current support level of $106 if the 21-day SMA support is broken. Technical Indicators  Resistance Levels: $100, $120, $140 Support Levels: $60, $40, $20 LTC price indicators analysis Litecoin’s price is squeezed between the moving average lines. It is unclear in which direction Litecoin will move. The moving average lines are horizontal in both charts. However, the price bars are limited to the distance between the moving averages. The price bars on the 4-hour chart are below the moving average lines. LTC/USD price chart – September 17, 2025 What is the next move for LTC? On the 4-hour chart, Litecoin is currently trading in a bearish trend zone. The altcoin is trading above the $112 support and below the moving average lines, which represent resistance at $116. The upward movement is hindered by the moving average lines, which are causing the price to oscillate within a limited range. Meanwhile, the signal for the cryptocurrency is bearish, with price bars below the moving average…
Paylaş
BitcoinEthereumNews2025/09/18 08:15
River Token Plunges 20.8% in 24 Hours: On-Chain Data Reveals Pressure Points

River Token Plunges 20.8% in 24 Hours: On-Chain Data Reveals Pressure Points

River (RIVER) experienced a sharp 20.8% decline to $12.35 within 24 hours, erasing $64 million in market capitalization. Our data analysis reveals concerning volume
Paylaş
Blockchainmagazine2026/03/09 18:04