The Hedera price continues to sit in a consolidation phase, but several recent developments show that institutional interest around the network is growing.  FreshThe Hedera price continues to sit in a consolidation phase, but several recent developments show that institutional interest around the network is growing.  Fresh

ChatGPT Predicts Hedera (HBAR) Price if the RWA Boom Hits the Network in 2026

2026/03/08 21:00
Okuma süresi: 3 dk
Bu içerikle ilgili geri bildirim veya endişeleriniz için lütfen crypto.news@mexc.com üzerinden bizimle iletişime geçin.

The Hedera price continues to sit in a consolidation phase, but several recent developments show that institutional interest around the network is growing. 

Fresh capital is entering the ecosystem, new enterprise partners are joining governance, and analysts are increasingly pointing to Hedera as a potential infrastructure layer for the real-world asset (RWA) sector.

One of the strongest signals came on March 4, when Canary’s HBAR ETF recorded $93 million in inflows, highlighting steady institutional demand even during a softer crypto market.

Momentum around the RWA narrative is also building. Analysts now mention Hedera as one of the networks positioned to benefit if the tokenization of real-world assets accelerates following regulatory clarity in the United States.

Another major signal arrived when FedEx joined Hedera’s Governing Council, adding one of the world’s largest logistics companies to the network’s enterprise-led governance structure.

Taken together, these developments show that Hedera (HBAR) continues to expand its institutional footprint even as price action remains relatively quiet.

Read Also: Is the Shiba Inu (SHIB) Price Bottom In? Analyst Points to Two Key Levels for a Possible Bounce

Hedera Gains Visibility in the RWA Sector

A recent post from crypto commentator Bmendo highlighted another milestone for the network. The analytics platform rwa.xyz has officially added Hedera, allowing full transparency and tracking of institutional assets issued on the network.

Current data shows roughly $119.1 million in tokenized real-world assets running on Hedera. These include projects from Circle, RedSwan Digital Real Estate, and the regulated digital asset exchange Archax.

For supporters of the network, this development matters because rwa.xyz is widely used by investors to track where real-world assets are being issued across blockchain ecosystems.

Hedera’s hashgraph consensus, low transaction fees, and high throughput make it a practical settlement layer for large financial instruments. If the tokenization trend continues expanding, networks capable of supporting large-scale financial activity could see rapid growth.

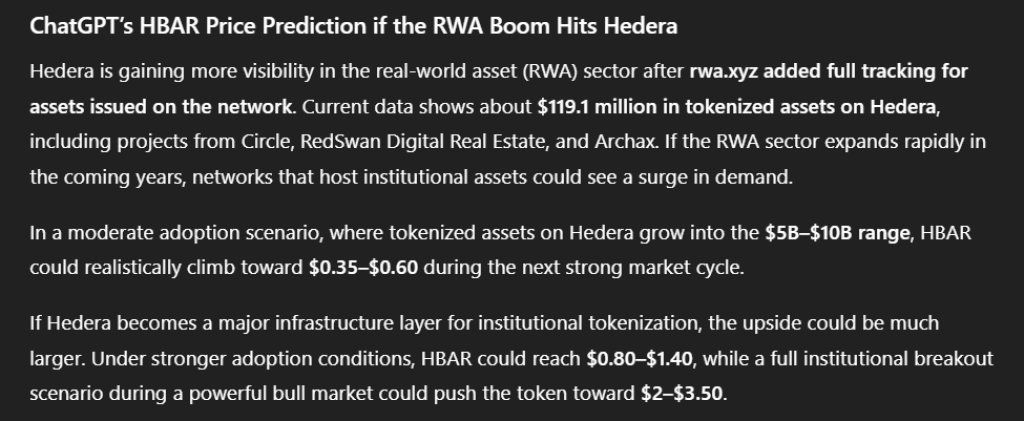
ChatGPT’s HBAR Price Prediction if the RWA Boom Hits Hedera

Hedera is gaining more visibility in the real-world asset (RWA) sector after rwa.xyz added full tracking for assets issued on the network. 

Current data shows about $119.1 million in tokenized assets on Hedera, including projects from Circle, RedSwan Digital Real Estate, and Archax. If the RWA sector expands rapidly in the coming years, networks that host institutional assets could see a surge in demand.

Source: ChatGPT

In a moderate adoption scenario, where tokenized assets on Hedera grow into the $5B–$10B range, the HBAR price could realistically climb toward $0.35–$0.60 during the next strong market cycle.

If Hedera becomes a major infrastructure layer for institutional tokenization, the upside could be much larger. Under stronger adoption conditions, HBAR could reach $0.80–$1.40, while a full institutional breakout scenario during a powerful bull market could push the token toward $2–$3.50.

Subscribe to our YouTube channel for daily crypto updates, market insights, and expert analysis.

The post ChatGPT Predicts Hedera (HBAR) Price if the RWA Boom Hits the Network in 2026 appeared first on CaptainAltcoin.

Piyasa Fırsatı
Allo Logosu
Allo Fiyatı(RWA)
$0.001976
$0.001976$0.001976
-0.45%
USD
Allo (RWA) Canlı Fiyat Grafiği
Sorumluluk Reddi: Bu sitede yeniden yayınlanan makaleler, halka açık platformlardan alınmıştır ve yalnızca bilgilendirme amaçlıdır. MEXC'nin görüşlerini yansıtmayabilir. Tüm hakları telif sahiplerine aittir. Herhangi bir içeriğin üçüncü taraf haklarını ihlal ettiğini düşünüyorsanız, kaldırılması için lütfen crypto.news@mexc.com ile iletişime geçin. MEXC, içeriğin doğruluğu, eksiksizliği veya güncelliği konusunda hiçbir garanti vermez ve sağlanan bilgilere dayalı olarak alınan herhangi bir eylemden sorumlu değildir. İçerik, finansal, yasal veya diğer profesyonel tavsiye niteliğinde değildir ve MEXC tarafından bir tavsiye veya onay olarak değerlendirilmemelidir.

Ayrıca Şunları da Beğenebilirsiniz

Dogecoin Rally Sparks Meme Coin Frenzy – Is Maxi Doge the Next to Pump?

Dogecoin Rally Sparks Meme Coin Frenzy – Is Maxi Doge the Next to Pump?

The crypto market is once again buzzing with excitement as meme coins prepare for what could be another explosive rally. Meme coin market capitalization rose 7% in the past 24 hours, with trading volume up 50%, according to CoinMarketCap, as both whales and retail traders return. This surge of momentum has many calling it the […]
Paylaş
The Cryptonomist2025/09/19 02:18
Litecoin Fluctuates Below The $116 Threshold

Litecoin Fluctuates Below The $116 Threshold

The post Litecoin Fluctuates Below The $116 Threshold appeared on BitcoinEthereumNews.com. Sep 17, 2025 at 23:05 // Price Litecoin price analysis by Coinidol.com: LTC price has slipped below the moving average lines after hitting resistance at $120. Litecoin price long-term prediction: bearish The 21-day SMA support helped to alleviate the selling pressure. In other words, the price of the cryptocurrency is above the 21-day SMA support but below the 50-day SMA barrier. This suggests that Litecoin will be trapped in a narrow range for a few days. If the 21-day SMA support or the 50-day SMA barrier is overreached, the cryptocurrency will trend upwards. For example, if the LTC price breaks through the 50-day SMA barrier, it will rise to a high of $124. Litecoin will fall to its current support level of $106 if the 21-day SMA support is broken. Technical Indicators  Resistance Levels: $100, $120, $140 Support Levels: $60, $40, $20 LTC price indicators analysis Litecoin’s price is squeezed between the moving average lines. It is unclear in which direction Litecoin will move. The moving average lines are horizontal in both charts. However, the price bars are limited to the distance between the moving averages. The price bars on the 4-hour chart are below the moving average lines. LTC/USD price chart – September 17, 2025 What is the next move for LTC? On the 4-hour chart, Litecoin is currently trading in a bearish trend zone. The altcoin is trading above the $112 support and below the moving average lines, which represent resistance at $116. The upward movement is hindered by the moving average lines, which are causing the price to oscillate within a limited range. Meanwhile, the signal for the cryptocurrency is bearish, with price bars below the moving average…
Paylaş
BitcoinEthereumNews2025/09/18 08:15
River Token Plunges 20.8% in 24 Hours: On-Chain Data Reveals Pressure Points

River Token Plunges 20.8% in 24 Hours: On-Chain Data Reveals Pressure Points

River (RIVER) experienced a sharp 20.8% decline to $12.35 within 24 hours, erasing $64 million in market capitalization. Our data analysis reveals concerning volume
Paylaş
Blockchainmagazine2026/03/09 18:04