

Can Memecore Break Above $1.60 After Weeks of Consolidation?
- Memecore is trading around $1.42 after facing resistance near $1.60 and support near $1.30.
- Technical signals like moving averages, RSI, and MACD suggest early signs of potential recovery, but the coin remains in consolidation.
Memecore (M) has been navigating a prolonged consolidation phase after experiencing a sharp correction from its previous highs. While the global crypto market sentiment remains mixed, technical indicators suggest that a potential trend reversal could be forming on the daily timeframe.
At the time of writing, Memecore is trading around $1.42, showing modest intraday volatility. The memecoin has been moving within a tight range over the past several weeks, hinting at indecision between buyers and sellers.
Memecore recently faced rejection near the $1.60 resistance zone, which aligns with the upper boundary of its recent consolidation range. On the downside, immediate support is located near $1.28–$1.30, a level that has repeatedly attracted buying pressure.
A decisive breakout above $1.60 could open the door to $1.80 and potentially push toward the $2.00 psychological resistance level. However, if the meme coin fails to hold above $1.30, it may expose the token to further downside toward the $1.15 support region.
The narrowing price structure suggests that a volatility expansion may be approaching, as the market prepares for its next significant move.
Technical Indicators Signal Early Recovery Signs
On the daily chart, the 9-day moving average sits at $1.4179, while the 21-day moving average stands at $1.3802. Importantly, the 9 MA is positioned above the 21 MA, signaling a short-term bullish crossover structure. This indicates that near-term momentum is attempting to shift in favor of buyers after weeks of downside pressure.
The meme coin price is currently trading slightly above both moving averages, suggesting that bulls are trying to establish short-term control. Still, a sustained hold above this MA cluster is required to confirm continuation strength. If the price closes decisively above the recent swing highs, the bullish MA alignment could gain further confirmation.
Meanwhile, the RSI (14) reads 49.72, with its moving average at 46.83. RSI hovering near the 50 midpoint reflects neutral momentum. Notably, RSI has recovered from oversold territory seen earlier in the downtrend, suggesting selling pressure has weakened. A move above 55–60 would strengthen bullish momentum confirmation.
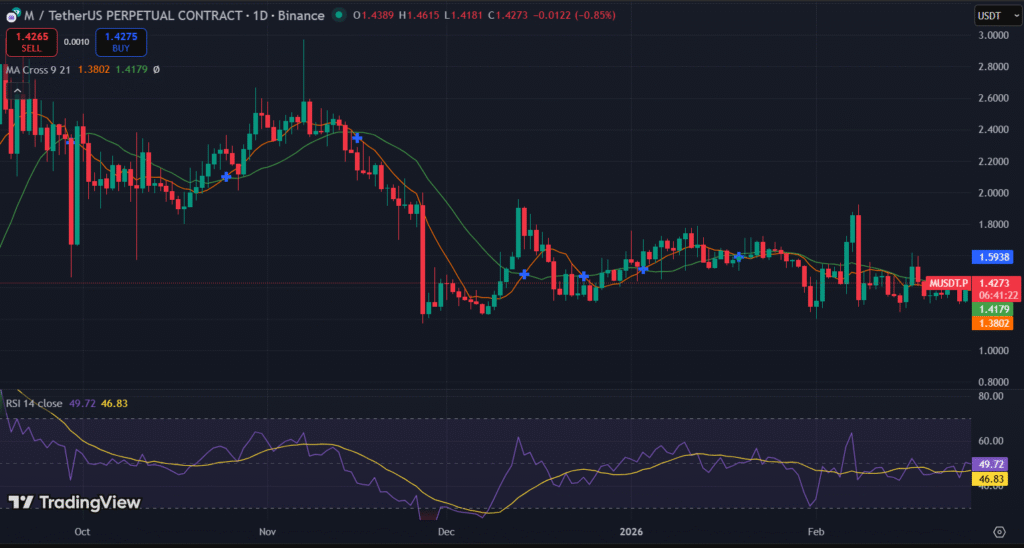 (Source: TradingView)
Also, the MACD indicator is showing early signs of convergence. The histogram is gradually shrinking, suggesting that bearish momentum is weakening. A confirmed expansion above the zero line would significantly strengthen the reversal case.
Zooming in, the Bollinger Bands are tightening, signaling reduced volatility. With price hovering near the mid-band ($1.3961), Memecore remains in consolidation. A sustained breakout above $1.5124 could trigger bullish expansion, while a breakdown below $1.2797 may invite renewed downside pressure.
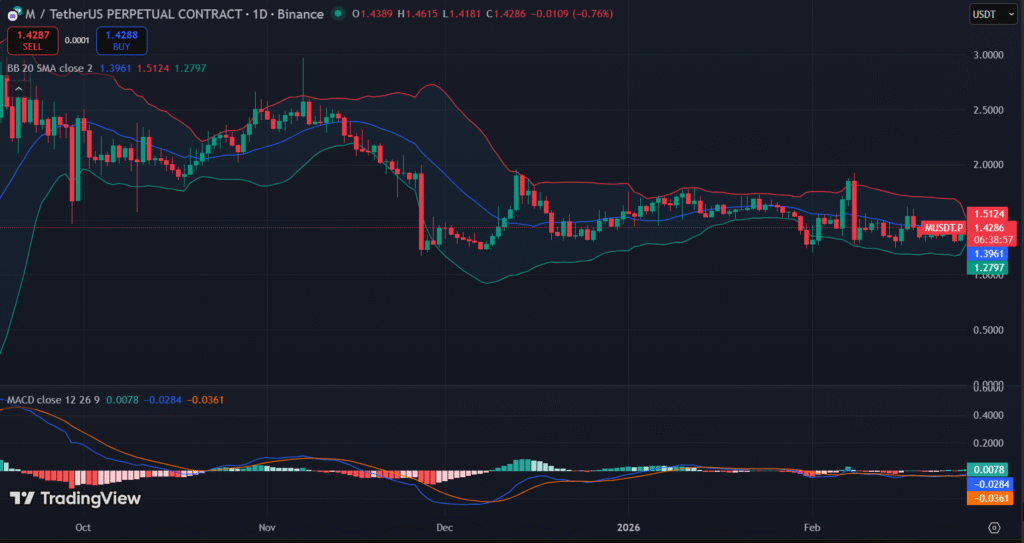 (Source: TradingView)
If buying volume increases alongside a breakout, Memecore could shift from consolidation to recovery mode. Memecore’s current structure suggests accumulation rather than aggressive selling. While confirmation is still needed, momentum indicators are gradually improving.
For now, the $1.60 resistance and $1.30 support zones are important. A breakout or breakdown from this range will likely determine the token’s next directional move.
Highlighted Crypto News:
Elizabeth Warren Presses OCC Over UAE Stake in World Liberty Application
Ayrıca Şunları da Beğenebilirsiniz

Crypto News: Pepeto Announces $7.3M raised Fast Positioning as the BNB of Meme Coins While Bitcoin Price Prediction Models Target $225,000

SBI Holdings is dangling XRP to sell a plain three year bond, but the numbers show how small
