

Bitcoin Cash (BCH) Slides 10% and Enters Danger Territory: Is a Crash Below $400 Brewing?
- With a 10% slip, Bitcoin Cash is trading at $484.
- BCH’s daily trading volume has increased by 22%.
Without a shift in the market sentiment, the assets are charted in the red zone, falling. The market cap is stationed at $2.18 trillion after a 2.35% drop. Along with the altcoins, the largest asset, Bitcoin (BTC), has slid over 2%, hovering at around $63K. Meanwhile, Bitcoin Cash (BCH) has posted a 10.28% plunge in the last 24 hours.
The asset kicked off the day trading at a high of $545.58. Later, with the bearish encounter in the BCH market, the price dropped to its low of $483.48. As per CMC data, at the time of writing, Bitcoin Cash trades at around $484.18, and the daily trading volume has surged by over 22.57%, reaching the $572.54 million mark.
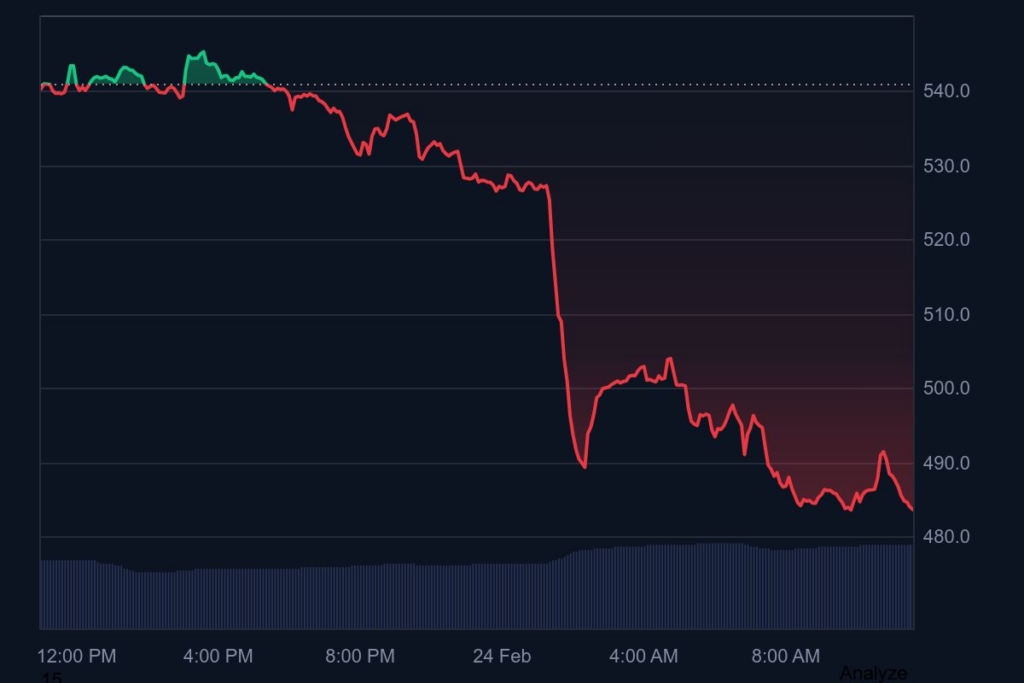 BCH price (Source: CMC)
Bitcoin Cash’s recent downside momentum could push the price toward a key support range at $473.38. If the bearish correction gains more traction, it might trigger the emergence of the death cross. Eventually, the bears would take the asset’s price below the $462 zone.
Conversely, assuming the bulls reclaim the momentum, the Bitcoin Cash price might move upward to the $495.62 resistance level. With a steady pressure on the upside, the golden cross could take place, which likely sends the price to its previous high at around $506.91 and further high.
Bitcoin Cash at Risk: Charts Point to a Bearish Shift
The technical analysis of Bitcoin Cash exhibits that the Moving Average Convergence Divergence (MACD) and signal lines are below the zero line. It indicates the broader bearish outlook, with weak price action. Until a crossover above zero occurs, the overall trend remains cautious.
In addition, the indicator, which assesses the capital flow, the Chaikin Money Flow (CMF) value is settled at -0.25, suggesting strong capital outflow from the asset. It reflects sustained selling pressure. If it remains in deep negative territory, BCH may continue facing downward pressure.
Bitcoin Cash’s daily Relative Strength Index of 19.98 implies its deep oversold condition, showing extremely strong selling. The price is tanking so fast it might soon run out of steam. Low RSI level confirms bearish dominance and weak momentum.
Moreover, the Bull Bear Power (BBP) reading of BCH is at -80.2, signalling a strong bearish dominance, with sellers firmly in control. Notably, the price is stuck below its average and diving hard; sellers are completely in control, and buyers can’t catch a break.
Top Updated Crypto News
WLFI Stablecoin USD1 has Recovered from Coordinated Attack
Ayrıca Şunları da Beğenebilirsiniz

USD/INR Exchange Rate Shows Remarkable Resilience Despite Alarming Decline in Foreign Institutional Investment

TeraWulf Revenue Jumps 20% but Massive $661M Loss Raises Eyebrows
