Bitcoin Cash (BCH) at a Crossroads: Bulls Charging or Bears Reloading?
- Bitcoin Cash is currently trading at $562.
- BCH’s trading volume has reached $374M.
As of 17th February, the crypto market is swinging between red and green charts, finding the right direction to move on. Notably, extreme fear sentiment is visible across the digital assets. Meanwhile, Bitcoin (BTC) and Ethereum (ETH) are attempting a recovery. Among the altcoin pack, Bitcoin Cash (BCH) has spiked by 0.34% in the last 24 hours.
The asset’s lowest and highest trading range was noted at $552.29 and $579.70, respectively. At the time of writing, Bitcoin Cash trades within the $562.65 level, with its daily trading volume reaching the $374.1 million mark. Besides, the market has experienced a $784.06K worth of BCH liquidation, as per Coinglass data.
As the bears of Bitcoin Cash gained more traction, the price could slip and test the key support at around $550.49. Further correction on the downside triggers the formation of the death cross, and gradually, the price movement may retrace even lower below $538.25.
Conversely, if the asset’s momentum takes a bullish turn, the price action might climb toward the $574.51 resistance level. With the upside pressure, assuming the bulls initiate the golden cross to emerge, the Bitcoin Cash price could rise to $586.74 or even higher.
Will Bitcoin Cash’s Short-Term Weakness Deepen Further?
Bitcoin Cash’s technical analysis reports that the Moving Average Convergence Divergence (MACD) line is positioned below the signal line. It indicates the presence of a short-term bearish momentum. As long as both lines hold above zero, the wider trend continues to favour the bulls.
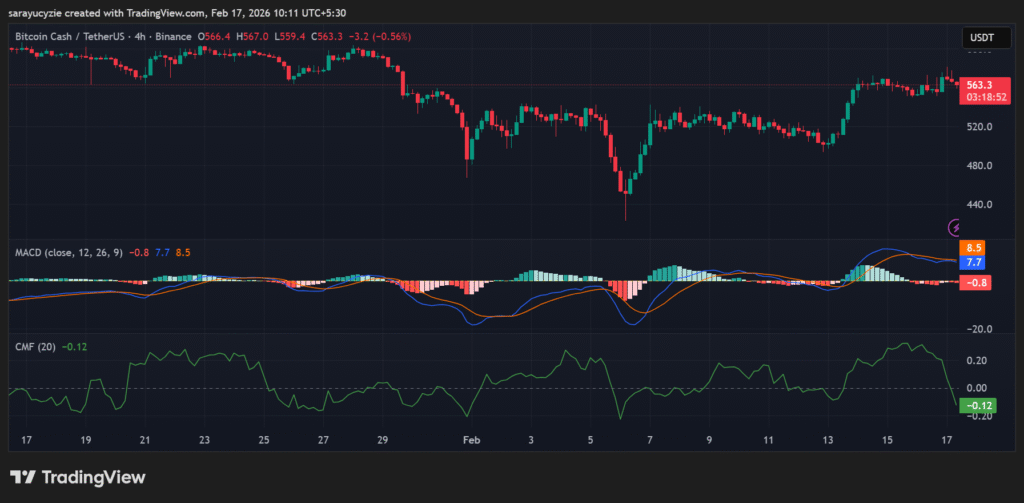 BCH chart (Source: TradingView)
The Chaikin Money Flow (CMF) is settled at -0.12, suggesting moderate selling pressure in the BCH market. Since the value is below zero, the money is flowing out of the asset, which hints at distribution rather than accumulation. The strength is not extreme, but bears have the edge.
Besides, the daily Relative Strength Index (RSI) of Bitcoin Cash is found at 58.72, implying mild bullish momentum. With the reading above the neutral level, 50, the buyers have the edge. There is a bullish bias, and enough room to move higher. BCH’s Bull Bear Power (BBP) is stationed at 4.2 signals strong bullish dominance. The buyers are pushing the price significantly above the moving average, and likely reflecting solid upward momentum.
Top Updated Crypto News
Cryptocurrency and Other Global Markets React to Upcoming US-Iran Talks
Ayrıca Şunları da Beğenebilirsiniz
Trump ridiculed for 'sending out invitations to WWIII' as he 'pleads' allies for Iran help

The Bitcoin Exchange Whale Ratio Hits Its Highest Level in Six Years