Solana (SOL) Price: Is the 31% Yearly Drop a Buying Opportunity?
TLDR
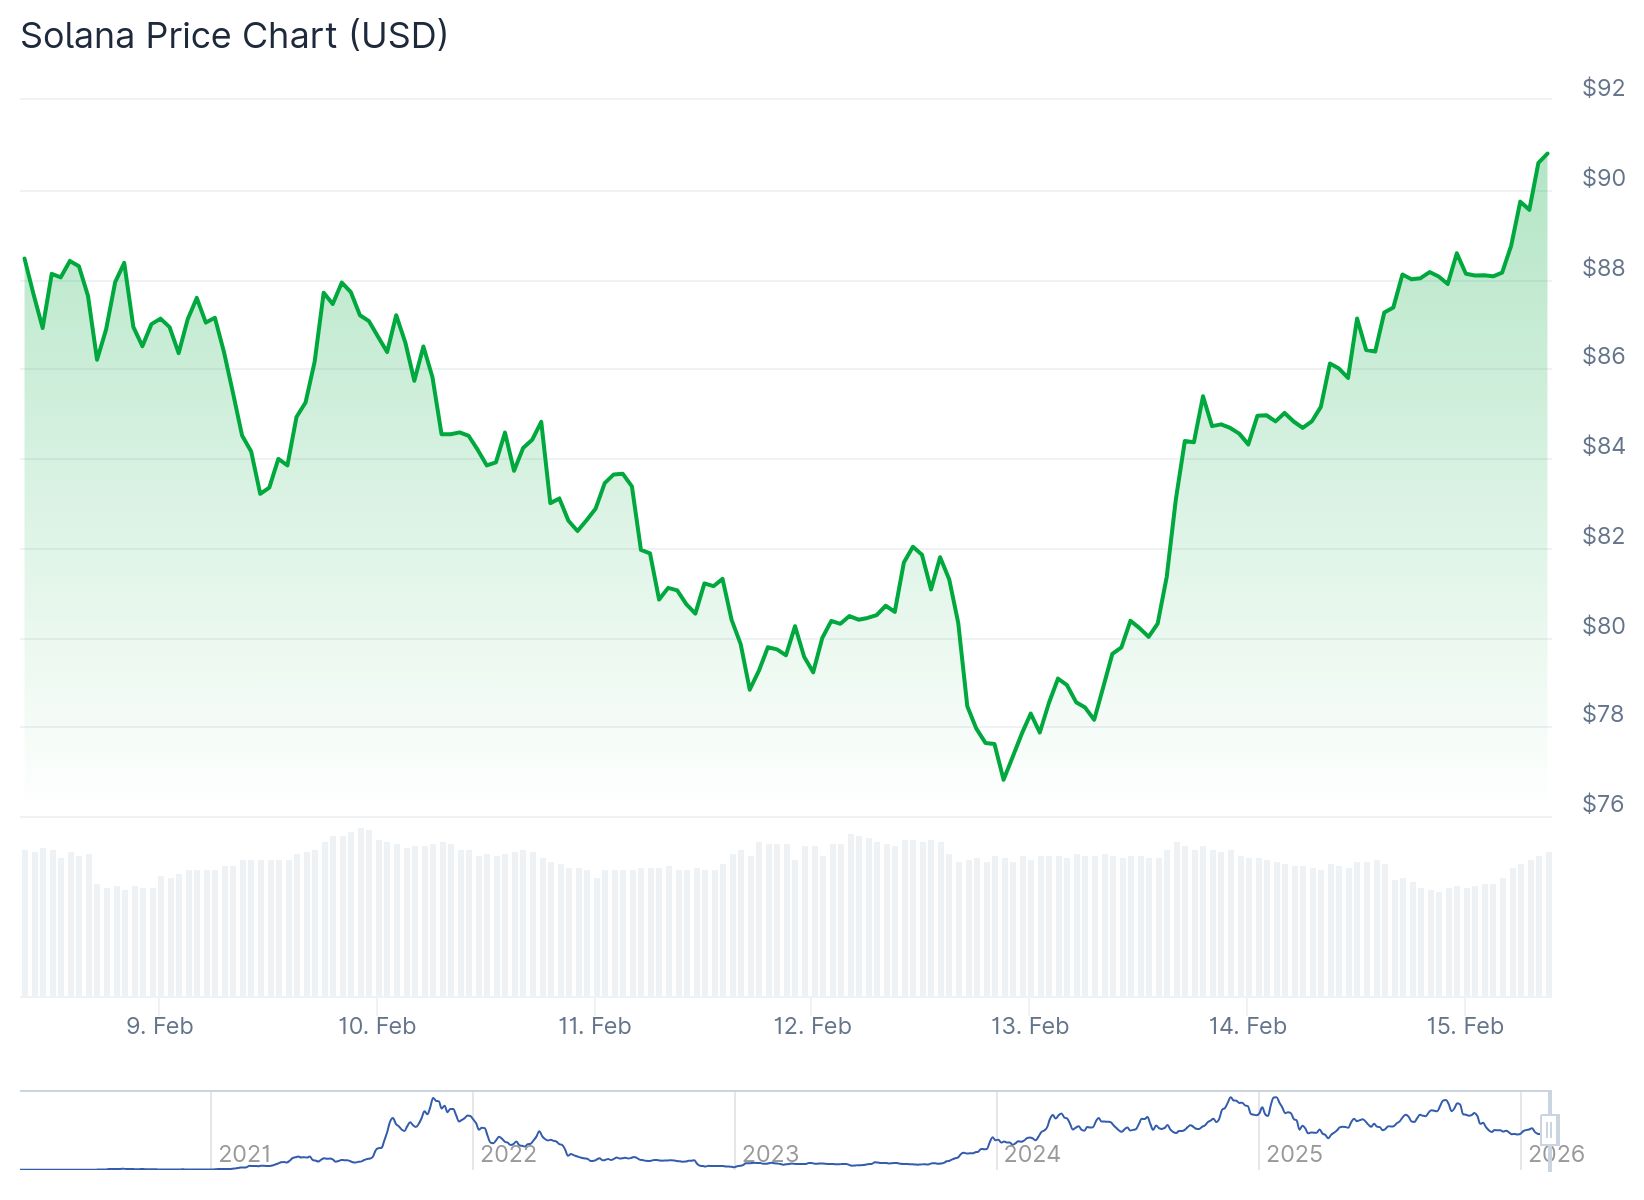
- Solana (SOL) rallied 8.53% to $84.73 on February 14, with $6.32 billion in trading volume and a $48.12 billion market cap.
- Historical fractal patterns show SOL previously rallied 24,234% from $1.07 to $260 in 2020-2021, then gained 3,700% from $7.78 to $295 in 2022-2025.
- Analysts identify a potential accumulation zone between $30 and $50 if the price continues declining, with long-term targets of $500 to $1,000 if patterns repeat.
- Solana’s DeFi TVL reached an all-time high of $80 million, while the network processes nearly $100 million in daily memecoin launchpad volume.
- SOL has dropped 31% in 2026 and remains below its 200-day EMA, with the RSI in oversold territory but no clear bullish divergence yet.
Solana climbed 8.53% to $84.73 on February 14, generating $6.32 billion in trading volume. The token’s market cap stands at $48.12 billion, representing 2.01% of the total crypto market.
 Solana (SOL) Price
Despite the recent price increase, SOL has fallen 31% since the start of 2026. The decline makes Solana one of the weaker performers among major cryptocurrencies this year.
The network’s on-chain metrics tell a different story. Solana’s DeFi total value locked (TVL) reached a new all-time high of $80 million, driven by strong stablecoin inflows.
Real-world asset (RWA) projects on Solana also hit new highs. High liquidity and growing TVL indicate that investors continue locking capital into the network.
 Source: DefiLlama
Technical Analysis Points to Accumulation Phase
Analysts are examining historical fractal patterns from previous Solana cycles. During Cycle 1 from 2020 to 2021, SOL rallied from $1.07 to $260, a gain of 24,234%. The token then crashed 97% to $7.78.
In Cycle 2 from 2022 to 2025, Solana increased 3,700% from $7.78 to $295. The cryptocurrency is currently down about 77% from its peak.
Crypto analyst CryptoPatel suggests the price could decline to the 0.5-0.618 Fibonacci levels if the historical pattern continues. This would place SOL in an accumulation zone between $30 and $50.
If the pattern repeats, long-term targets could range from $500 to $1,000. However, these projections depend on historical patterns continuing and are not guaranteed predictions.
The recent price action shows a strong bottoming candle with a long lower wick. This formation typically signals buying pressure at lower levels.
SOL currently sits at the 0.382 Fibonacci level, which corresponds to a high-volume area between the S1 and S2 pivot points. The daily Relative Strength Index (RSI) is in oversold territory.
The cryptocurrency remains below its daily pivot point and 200-day exponential moving average (EMA). This positioning indicates the overall trend remains bearish.
Memecoin Activity Surges on Network
Solana memecoin launchpads processed nearly $100 million in daily volume. New token launches averaged 30,000 per day this week, according to Dune Analytics data.
 Source: Dune
The memecoin sector’s market cap fell 3.5% to $30.2 billion over the past 30 days. During the same period, SOL dropped 8.5%, meaning memecoins outperformed the native token.
Pippin (PIPPIN) surged over 100% in a single week, surpassing a $535 million market cap. In contrast, established memecoins like Dogecoin (DOGE) and Shiba Inu (SHIB) posted declines.
High memecoin activity often reflects short-term speculative trading rather than long-term conviction. The ongoing memecoin frenzy may be masking the network’s fundamental strength.
Capital continues flowing into Solana’s DeFi ecosystem despite the price weakness. The divergence between price performance and on-chain activity has raised questions about whether SOL is undervalued.
When prices diverge from fundamentals, it can signal that investors maintain conviction in the network’s long-term potential. However, the memecoin speculation complicates this interpretation.
Solana processed 30,000 new token launches daily this week, with memecoin launchpads handling $100 million in daily volume.
The post Solana (SOL) Price: Is the 31% Yearly Drop a Buying Opportunity? appeared first on CoinCentral.
Ayrıca Şunları da Beğenebilirsiniz

Ripple Backed SBI Holdings CEO Breaks Silence on $10 Billion XRP Holdings Report

SBI Doesn’t Hold $10B in XRP, CEO Says