The post AXS Price Rebounds as Breakout Structure Forms: Is a 100% Rally Setting Up? appeared first on Coinpedia Fintech News Axie Infinity’s AXS token is beginningThe post AXS Price Rebounds as Breakout Structure Forms: Is a 100% Rally Setting Up? appeared first on Coinpedia Fintech News Axie Infinity’s AXS token is beginning

AXS Price Rebounds as Breakout Structure Forms: Is a 100% Rally Setting Up?

2026/02/09 18:13
Okuma süresi: 2 dk
Why is the Axie Infinity (AXS) Price Rising Today Is Liquidity Rotating Into GameFi

The post AXS Price Rebounds as Breakout Structure Forms: Is a 100% Rally Setting Up? appeared first on Coinpedia Fintech News

Axie Infinity’s AXS token is beginning to regain attention after a sharp rebound from recent lows, rising more than 18% in the latest session as broader market sentiment steadies. The move follows an extended decline that pushed AXS price into deeply compressed price territory, where selling pressure began to fade and buyers cautiously stepped back in. While the rebound itself is notable, the larger focus for traders is the structure forming beneath the surface. AXS is not simply bouncing on momentum, it is compressing into a zone where volatility has been steadily declining, often a precursor to larger directional moves. 

That setup has placed the token back on watchlists, even as confirmation remains pending. The question now is not whether AXS has bounced, but whether this rebound is evolving into something structurally more meaningful.

AXS Price Breakout Brings Potential Rally Into Focus

For the past sessions, AXS price continues to trade inside a falling wedge pattern, defined by lower highs and lower lows, converging into a tightening range. This structure typically reflects weakening downside momentum, rather than aggressive distribution. Importantly, AXS token has succeeded to mark a close above the trendline barrier of $1.40. Currently, AXS price is trading around $1.52 and displaying buying momentum during the intraday session. 

AXS Price

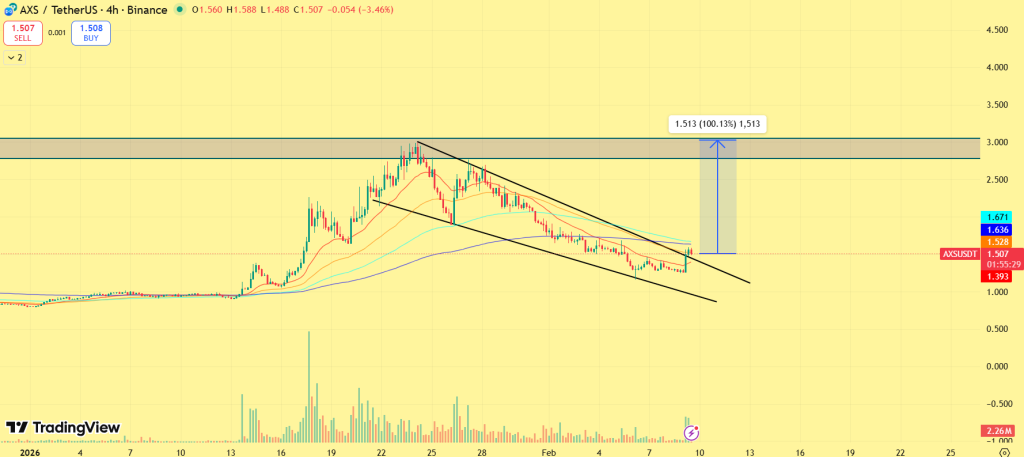
The falling wedge pattern breakout move suggests a next bullish leg intact. Once price surpasses above the $1.55-$1.60 with strong volume, AXS token may see a 100% rally toward the major supply zone of $3 in the near-term. Axie Infinity token has begun forming higher lows on intraday and short-term timeframes, a subtle but important shift from the persistent lower-low sequence that defined the prior downtrend. For AXS, multiple EMAs hurdle placed around $1.60 which is the make-or-break zone. If bulls succeed to close above the region, a strong rally could be seen ahead. A rejection from that region may pull AXS inside the narrow range.

Piyasa Fırsatı
Axie Infinity Logosu
Axie Infinity Fiyatı(AXS)
$1.4188
$1.4188$1.4188
+1.17%
USD
Axie Infinity (AXS) Canlı Fiyat Grafiği
Sorumluluk Reddi: Bu sitede yeniden yayınlanan makaleler, halka açık platformlardan alınmıştır ve yalnızca bilgilendirme amaçlıdır. MEXC'nin görüşlerini yansıtmayabilir. Tüm hakları telif sahiplerine aittir. Herhangi bir içeriğin üçüncü taraf haklarını ihlal ettiğini düşünüyorsanız, kaldırılması için lütfen service@support.mexc.com ile iletişime geçin. MEXC, içeriğin doğruluğu, eksiksizliği veya güncelliği konusunda hiçbir garanti vermez ve sağlanan bilgilere dayalı olarak alınan herhangi bir eylemden sorumlu değildir. İçerik, finansal, yasal veya diğer profesyonel tavsiye niteliğinde değildir ve MEXC tarafından bir tavsiye veya onay olarak değerlendirilmemelidir.

Ayrıca Şunları da Beğenebilirsiniz

Microsoft Corp. $MSFT blue box area offers a buying opportunity

Microsoft Corp. $MSFT blue box area offers a buying opportunity

The post Microsoft Corp. $MSFT blue box area offers a buying opportunity appeared on BitcoinEthereumNews.com. In today’s article, we’ll examine the recent performance of Microsoft Corp. ($MSFT) through the lens of Elliott Wave Theory. We’ll review how the rally from the April 07, 2025 low unfolded as a 5-wave impulse followed by a 3-swing correction (ABC) and discuss our forecast for the next move. Let’s dive into the structure and expectations for this stock. Five wave impulse structure + ABC + WXY correction $MSFT 8H Elliott Wave chart 9.04.2025 In the 8-hour Elliott Wave count from Sep 04, 2025, we saw that $MSFT completed a 5-wave impulsive cycle at red III. As expected, this initial wave prompted a pullback. We anticipated this pullback to unfold in 3 swings and find buyers in the equal legs area between $497.02 and $471.06 This setup aligns with a typical Elliott Wave correction pattern (ABC), in which the market pauses briefly before resuming its primary trend. $MSFT 8H Elliott Wave chart 7.14.2025 The update, 10 days later, shows the stock finding support from the equal legs area as predicted allowing traders to get risk free. The stock is expected to bounce towards 525 – 532 before deciding if the bounce is a connector or the next leg higher. A break into new ATHs will confirm the latter and can see it trade higher towards 570 – 593 area. Until then, traders should get risk free and protect their capital in case of a WXY double correction. Conclusion In conclusion, our Elliott Wave analysis of Microsoft Corp. ($MSFT) suggested that it remains supported against April 07, 2025 lows and bounce from the blue box area. In the meantime, keep an eye out for any corrective pullbacks that may offer entry opportunities. By applying Elliott Wave Theory, traders can better anticipate the structure of upcoming moves and enhance risk management in volatile markets. Source: https://www.fxstreet.com/news/microsoft-corp-msft-blue-box-area-offers-a-buying-opportunity-202509171323
Paylaş
BitcoinEthereumNews2025/09/18 03:50
Travelzoo Q4 2025 Earnings Conference Call on February 19 at 11:00 AM ET

Travelzoo Q4 2025 Earnings Conference Call on February 19 at 11:00 AM ET

NEW YORK, Feb. 9, 2026 /PRNewswire/ — Travelzoo® (NASDAQ: TZOO): WHAT: Travelzoo, the club for travel enthusiasts, will host a conference call to discuss the Company
Paylaş
AI Journal2026/02/10 01:46
TradFi vs. Crypto: Bybit Launches 300,000 USDT Trading Challenge as Copy Trading Gains Momentum in Volatility

TradFi vs. Crypto: Bybit Launches 300,000 USDT Trading Challenge as Copy Trading Gains Momentum in Volatility

DUBAI, UAE, Feb. 9, 2026 /PRNewswire/ — Bybit, the world’s second-largest cryptocurrency exchange by trading volume, is calling traders across the TradFi and crypto
Paylaş
AI Journal2026/02/10 01:45